article thumbnail

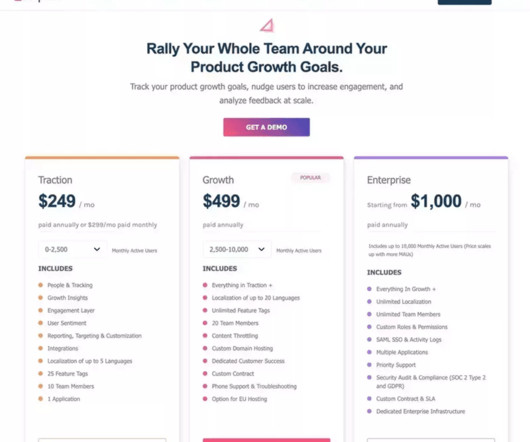
8 SaaS Dashboard Examples to Track Key Metrics

Userpilot

When it comes to product management, you need to look at different SaaS dashboard examples to see what kind of product analytics you can measure, and how. So what are the most important types of dashboards and which ones are the best for you? Book a Userpilot demo to get started! Example of NPS dashboard in Userpilot.

article thumbnail

10 Analytics Dashboard Examples to Gain Data Insights for SaaS [+Best Tools]

Userpilot

Analytics dashboards are visualization tools that give you an overview of key metrics. In this article, we’ll discuss 10 analytics dashboard examples. It will give you a better understanding of the type of metrics to monitor in your dashboard and help you draw product growth insights from them. Book a demo to learn more.

Insiders

Sign Up for our Newsletter

This site is protected by reCAPTCHA and the Google Privacy Policy and Terms of Service apply.

article thumbnail

Exploring Userpilot’s Resource Center Editor: A Walkthrough

Userpilot

Luckily, Userpilot’s resource center editor gives you full control and lots of fantastic options to choose from. In this article, we’re going to examine Userpilot’s resource center editor in depth. Start with set-up – get a resource center added via the engagement layer.

article thumbnail

Customer Engagement Dashboard: Which Metrics to Track and How to Create One

Userpilot

A customer engagement dashboard is invaluable for interpreting customer data and making the right business decisions. Read on to learn how to choose the right engagement metrics for your dashboard and how to build one code-free. User engagement dashboard tools to consider: Userpilot, Amplitude, and Mixpanel.

article thumbnail

Monetizing Analytics Features: Why Data Visualizations Will Never Be Enough

But today, dashboards and visualizations have become table stakes. Think your customers will pay more for data visualizations in your application? Five years ago they may have. Discover which features will differentiate your application and maximize the ROI of your embedded analytics. Brought to you by Logi Analytics.

article thumbnail

A practical guide to better dashboard design

nulab

A digital dashboard is a place where someone can view lots of data at once. How to create a dashboard your users will love. Dashboards shouldn’t show everything at once. Instead, think of your dashboard like the blurb to a book: it’s a summary that gives you a top-level overview, which you can drill down on later.

article thumbnail

How to Improve Customer Retention: 20 Actionable Strategies

Userpilot

Create comprehensive self-service resources to enable users to solve problems independently. Offer educational resources like guides and webinars to help users maximize product value. Create a customer retention analytics dashboard to measure success across key metrics. The solution?