article thumbnail

SaaS Customer Onboarding Dashboard: Definition & Examples

Userpilot

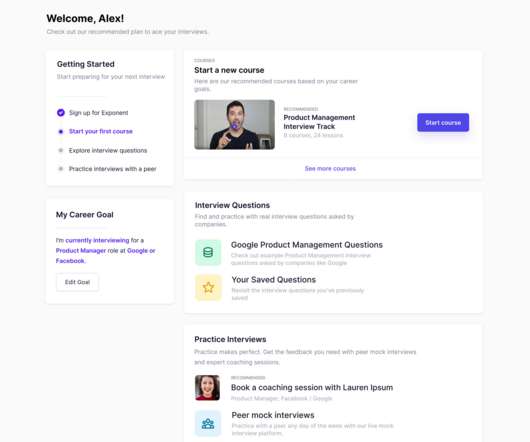
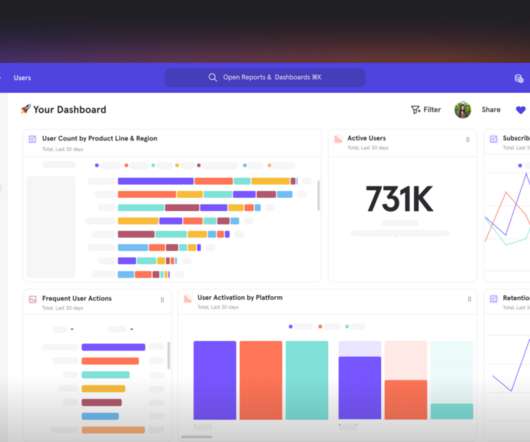
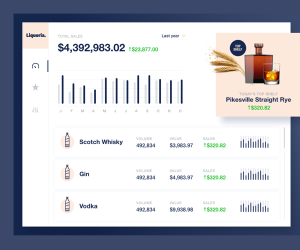
In SaaS, a customer onboarding dashboard can become a massive product analytics tool to understand and optimize the user journey. But what type of dashboards can you use to analyze your onboarding process? Let’s explore how a customer onboarding dashboard works and see different examples. Steps breakdown.

article thumbnail

Customer Sentiment Dashboard: Definition & Examples

Userpilot

A customer sentiment dashboard is a great way to visualize customer feedback and see what users love (or hate) about your product. TL;DR A sentiment analysis dashboard typically integrates information from multiple data sources, such as social media posts, customer reviews, survey responses , and customer service chats.

Insiders

Sign Up for our Newsletter

This site is protected by reCAPTCHA and the Google Privacy Policy and Terms of Service apply.

Trending Sources

article thumbnail

Top 12 Dashboard Reporting Tools For SaaS in 2024

Userpilot

As you’re researching dashboard reporting tools, you’ve probably noticed how hard it is to find reliable information on the available solutions. To make your life a little bit easier and help you choose the best dashboard analytics tool for your SaaS, we’ve produced a guide of 12 excellent platforms available on the market in 2024.

article thumbnail

SaaS KPI Dashboard: Components, Metrics, and Examples

Userpilot

With an abundance of product analytics to track, having a robust SaaS KPI dashboard is essential to monitor the metrics that matter most. This guide will walk you through what it is, why you need one, and how to build your very own dashboard. TL;DR A SaaS dashboard can be used to track important metrics and key performance indicators.

article thumbnail

The Definitive Guide to Dashboard Design

Dashboard design can mean the difference between users excitedly embracing your product or ignoring it altogether. Great dashboards lead to richer user experiences and significant return on investment (ROI), while poorly designed dashboards distract users, suppress adoption, and can even tarnish your project or brand.

article thumbnail

New User Activation Dashboard: Definition, Metrics, and Examples

Userpilot

In SaaS, a new user activation dashboard can become a massive product analytics tool to understand and optimize the user journey. But how can a dashboard for user activation can help you engage more users? What is a new user activation dashboard? moment ," impacting user retention and satisfaction.

article thumbnail

10 Analytics Dashboard Examples to Gain Data Insights for SaaS [+Best Tools]

Userpilot

Analytics dashboards are visualization tools that give you an overview of key metrics. In this article, we’ll discuss 10 analytics dashboard examples. It will give you a better understanding of the type of metrics to monitor in your dashboard and help you draw product growth insights from them. Book a demo to learn more.

article thumbnail

Monetizing Analytics Features: Why Data Visualizations Will Never Be Enough

But today, dashboards and visualizations have become table stakes. Think your customers will pay more for data visualizations in your application? Five years ago they may have. Discover which features will differentiate your application and maximize the ROI of your embedded analytics. Brought to you by Logi Analytics.

article thumbnail

7+ Graphics Libraries to Enhance Your Embedded Analytics

When your customers come to your app, what do they see: clunky, outdated dashboards or a sleek, modern interface? This e-book details a number of graphics libraries plus a few bonus tools to modernize your embedded dashboards.

article thumbnail

4 Approaches to Data Analytics

As the analytics landscape has evolved, application teams who need to embed dashboards, reports, and other analytics capabilities in their commercial and corporate applications can choose from dozens of solutions. How do you differentiate one solution from the next?

article thumbnail

Build Actionable Dashboards to Drive Your Business

Speaker: Jim O'Leary, VP of Product Management, and Brian Elmi, Director of Product Management, NTENT

Most product dashboard review lagging indicators rather than leading indicator and focus on the wrong metrics to move the business forward. Join Jim O'Leary and Brian Elmi of NTENT as they share exactly what they've done to build successful dashboards. How to democratize data so that all teams in an organization can benefit from it.

article thumbnail

Monetizing Analytics Features

But today, dashboards and visualizations have become table stakes. Think your customers will pay more for data visualizations in your application? Five years ago, they may have. Turning analytics into a source of revenue means integrating advanced features in unique, hard-to-steal ways.

article thumbnail

UX and Design Tips for Better Dashboards: Product Manager Laura Klein Explains How to Improve Your Analytics

Speaker: Laura Klein, Principal at Users Know and Author of UX for Lean Startups

That's why Laura Klein, product manager and UX designer, has a set of tips to help application teams improve their embedded dashboards and reports. No one makes poorly designed products on purpose. And yet we have so many of them in our lives.

article thumbnail

Business Monitoring Systems: Using ML to Analyze Metrics

The evolution of dashboards to automated business monitoring. Why automation elevates - not replaces - your embedded dashboards Download to learn: 5 business benefits of automated data discovery with ABM. How automated business monitoring separates insights from noise.

article thumbnail

How Embedding AI-Powered Analytics Can Give You a Competitive Advantage

Embedding dashboards and reports aren’t enough. Futureproof your application by offering instant, actionable insights that will give you and your customers a competitive advantage.