


How to Use Different Funnel Visualizations to Effectively Tell Your Data Analytics Story
Indicative
SEPTEMBER 8, 2020
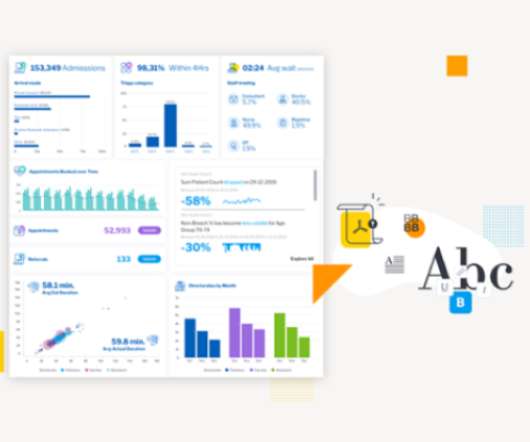
Real-World Applications: Practical Data Visualizations. This section will equip you with a short overview of 3 types of practical, every day charts. A best practice that we embrace at Indicative is that the graph or chart should speak for itself. So now we can make an informed decision on how best to set up our funnels.


Let's personalize your content