Remove tag metrics
article thumbnail

SaaS Customer Onboarding Dashboard: Definition & Examples

Userpilot

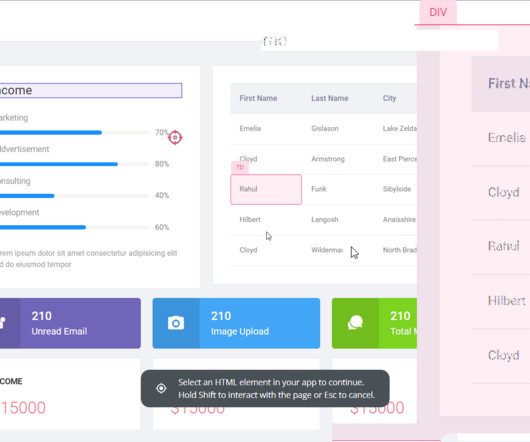
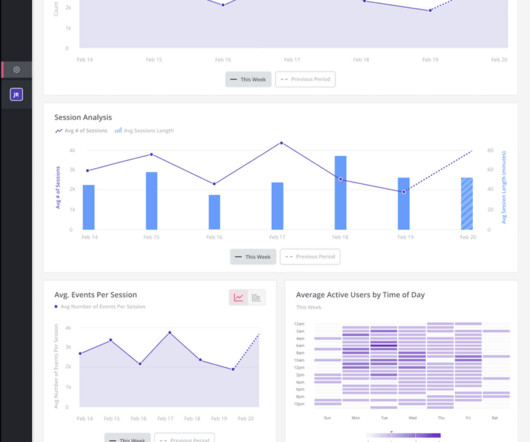
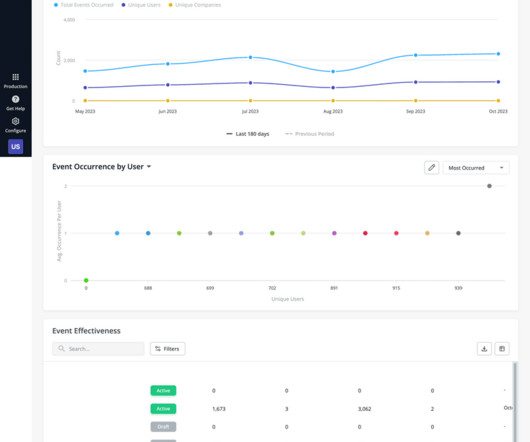
TL;DR A customer onboarding dashboard is an analytical tool designed to monitor and report different onboarding metrics. Create an onboarding metrics dashboard to measure KPIs like new signups, activation rate , and time to value. For this, you can use a tool like Userpilot to tag features and set up in-app events.

article thumbnail

How to Perform A Product Feature Analysis

Userpilot

Specify the metrics to track. Tag key features for tracking. Your objectives will inform your approach and the metrics to track. Specify the metrics to track Next, define the metrics that will aid your analysis. Specify the metrics to track Next, define the metrics that will aid your analysis.

Insiders

Sign Up for our Newsletter

This site is protected by reCAPTCHA and the Google Privacy Policy and Terms of Service apply.

Trending Sources

article thumbnail

Data Tracking: How to Create A Plan for Collecting and Analyzing Data?

Userpilot

Use feature tagging to track feature usage. The six key metrics to measure are conversion rate, activation rate, product adoption rate, retention rate, average revenue, and customer lifetime value. It involves tracking events and metrics and using the insights to make data-driven business decisions. Feature tagging in Userpilot.

article thumbnail

The Ultimate Guide to Google Analytics 4 for UX Designers and Business Owners

UX Planet

These visual reports provide me with a clear overview of key metrics and trends, allowing me to quickly identify patterns and areas of interest. link] Using Google Tag Manager : My preferred method is to use Google Tag Manager. With Google Tag Manager installed on your website, you no longer need to manually edit the code.

article thumbnail

Funnel Tracking: How to Track and Optimize Your Funnel

Userpilot

Marketing funnels attract and engage, using metrics like visitors and click-through rates to track narrowing interest and effectiveness. Tag and name key funnel events to track interactions like page visits, enabling funnel analysis for optimization and conversion improvement. Core metrics for marketing funnel.

article thumbnail

How to Perform Behavior Flow Analysis in GA4 + Better Alternative

Userpilot

You can choose 3 metrics to visualize in the report: Event count, Active users , and Total users. Within each of the categories, you can find the Overview report, where you can track the main site search metrics (like average session duration), and product KPIs. Feature tags and heatmaps Userpilot is a no-code analytics platform.

article thumbnail

In-App Events: What Are They and How to Set Up [+ Examples]

Userpilot

These goals can be tracking conversions from trial to paid users and ensuring data collection is aligned with your success metrics. Tagging and monitoring core product features to identify popular functionalities and user challenges is key to enhancing engagement. SMART goal-setting framework. Track onboarding completion in Userpilot.