Remove Dashboard Remove Data Remove Data Visualization Remove User Experience
article thumbnail

Customer Sentiment Dashboard: Definition & Examples

Userpilot

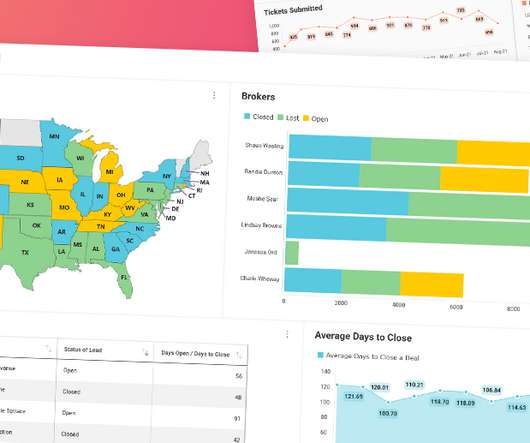
A customer sentiment dashboard is a great way to visualize customer feedback and see what users love (or hate) about your product. But how do you collect the right data for your analysis? This article shows you a step-by-step process and some of the best tools to use. However, a single data source (e.g.,

article thumbnail

23 Best User Experience Research Tools of 2024

Userpilot

Unfortunately, that technology isn’t here yet, so UX research tools are the next best thing. These tools can provide you with the qualitative and quantitative data you need to understand how your customer behaves in your product, so you can make the necessary changes to improve their experience.

Insiders

Sign Up for our Newsletter

This site is protected by reCAPTCHA and the Google Privacy Policy and Terms of Service apply.

Trending Sources

article thumbnail

User Experience Analytics in SaaS: Tools, Data Collection & More

Userpilot

User experience analytics is one of the secret ingredients for boosting SaaS growth. By regularly checking your analytics data, you will proactively spot issues and find ways to resolve them. This ensures your product remains enjoyable for users, boosting retention and loyalty. across the customer journey.

article thumbnail

8 SaaS Dashboard Examples to Track Key Metrics

Userpilot

When it comes to product management, you need to look at different SaaS dashboard examples to see what kind of product analytics you can measure, and how. So what are the most important types of dashboards and which ones are the best for you? Ready to transform your data into actionable insights?

article thumbnail

Monetizing Analytics Features: Why Data Visualizations Will Never Be Enough

Think your customers will pay more for data visualizations in your application? But today, dashboards and visualizations have become table stakes. Discover which features will differentiate your application and maximize the ROI of your embedded analytics. Brought to you by Logi Analytics.

article thumbnail

DIY Data Visualizations: Provide Unique Insights of Your Data with Reveal BI 

Reveal

Reveal Embedded Analytics We live in an era where data shapes decisions across industries. While data visualizations have become essential, not all standard visualizations cater to specialized reporting needs. Dive in to discover its unmatched benefits and how you can craft unique reports effortlessly.

article thumbnail

A Guide to Data-Driven Analytics in SaaS

Userpilot

What is data-driven analytics in SaaS? How to conduct user data analysis? What are the best analytics tools for the job? By understanding how users behave inside the product and their goals and problems, you can reduce time to value. Data collection comes next. Why is it important?

article thumbnail

The Definitive Guide to Dashboard Design

Dashboard design can mean the difference between users excitedly embracing your product or ignoring it altogether. Great dashboards lead to richer user experiences and significant return on investment (ROI), while poorly designed dashboards distract users, suppress adoption, and can even tarnish your project or brand.