article thumbnail

How to Use Userpilot Custom Analytics Dashboards to Extract Actionable Insights

Userpilot

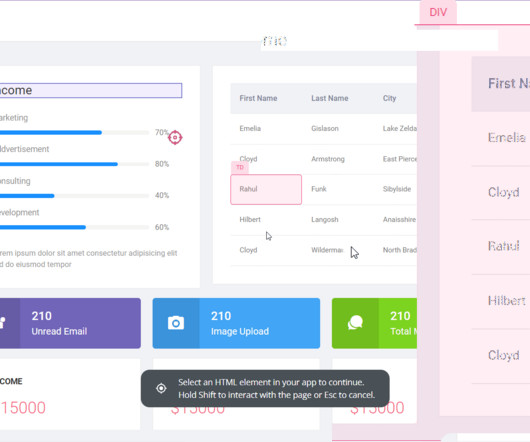
Are you wondering how the new Userpilot custom analytics dashboards can help you drive product growth? In this article, you will learn about the main benefits of custom product analytics dashboards and how to create them in Userpilot. Userpilot is a robust analytics tool so you can use its own data.

article thumbnail

10 Analytics Dashboard Examples to Gain Data Insights for SaaS [+Best Tools]

Userpilot

Are you tracking SaaS metrics without knowing how to make the analytics process easier? Analytics dashboards are visualization tools that give you an overview of key metrics. This makes it much easier to extract insights from your analysis compared to looking at mere numbers. Book a demo to learn more.

Insiders

Sign Up for our Newsletter

This site is protected by reCAPTCHA and the Google Privacy Policy and Terms of Service apply.

article thumbnail

Top 12 Dashboard Reporting Tools For SaaS in 2024

Userpilot

As you’re researching dashboard reporting tools, you’ve probably noticed how hard it is to find reliable information on the available solutions. TL;DR Dashboards display critical business data in real-time, streamlining decision-making and focusing on key metrics. Let’s dive in!

article thumbnail

What is Data Visualization? + Visual Data Tools

Userpilot

Visual data surrounds us – colorful charts on weather reports, infographics on the web and in social media articles, map charts in presentations, etc. To help you get started with data visualization, this article explores various visualization methods and their use cases. Funnel charts. Pie charts.

article thumbnail

Embedded Analytics Insights for 2024

Organizations look to embedded analytics to provide greater self-service for users, introduce AI capabilities, offer better insight into data, and provide customizable dashboards that present data in a visually pleasing, easy-to-access format.

article thumbnail

Customer Sentiment Dashboard: Definition & Examples

Userpilot

A customer sentiment dashboard is a great way to visualize customer feedback and see what users love (or hate) about your product. But how do you collect the right data for your analysis? This article shows you a step-by-step process and some of the best tools to use. Track customer behavior for experience insights.

article thumbnail

How to Build a Customer Success Dashboard Code-Free

Userpilot

Wondering how to build a customer success dashboard for your team? From the article, you will learn what a customer success dashboard is, why you need it, and what metrics it should include. And how to build a dashboard for your customer success team using Userpilot analytics ! Why does your team need a CS dashboard?

article thumbnail

Monetizing Analytics Features: Why Data Visualization Will Never Be Enough

Think your customers will pay more for data visualizations in your application? But today, dashboards and visualizations have become commonplace. Turning embedded analytics into a source of revenue means integrating advanced features in unique, hard-to-steal ways. Proven approaches to achieving analytics maturity.

article thumbnail

4 Approaches to Data Analytics

The world of data analytics is changing fast as organizations look to gain competitive advantages through the application of timely data. Choosing the best solution for your dashboards and reports starts with understanding the types of analytics solutions on the market. The pros and cons for each option.

article thumbnail

The Definitive Guide to Dashboard Design

Dashboard design can mean the difference between users excitedly embracing your product or ignoring it altogether. Great dashboards lead to richer user experiences and significant return on investment (ROI), while poorly designed dashboards distract users, suppress adoption, and can even tarnish your project or brand.

article thumbnail

Modern Data Architecture for Embedded Analytics

Every data-driven project calls for a review of your data architecture—and that includes embedded analytics. Before you add new dashboards and reports to your application, you need to evaluate your data architecture with analytics in mind.

article thumbnail

Monetizing Analytics Features

Think your customers will pay more for data visualizations in your application? But today, dashboards and visualizations have become table stakes. Turning analytics into a source of revenue means integrating advanced features in unique, hard-to-steal ways. Five years ago, they may have.

article thumbnail

How Embedded Analytics Gets You to Market Faster with a SAAS Offering

Start-ups & SMBs launching products quickly must bundle dashboards, reports, & self-service analytics into apps. Customers expect rapid value from your product (time-to-value), data security, and access to advanced capabilities. Embedded analytics offers a strategic solution to this challenge. Here’s how.

article thumbnail

UX and Design Tips for Better Dashboards: Product Manager Laura Klein Explains How to Improve Your Analytics

Speaker: Laura Klein, Principal at Users Know and Author of UX for Lean Startups

That's why Laura Klein, product manager and UX designer, has a set of tips to help application teams improve their embedded dashboards and reports. How to avoid common mistakes people make when presenting data. And yet we have so many of them in our lives. Ways to craft the experience that users will have with your application.

article thumbnail

The Essential Guide to Analytic Applications

Embedding dashboards, reports and analytics in your application presents unique opportunities and poses unique challenges. We interviewed 16 experts across business intelligence, UI/UX, security and more to find out what it takes to build an application with analytics at its core.