This site uses cookies to improve your experience. To help us insure we adhere to various privacy regulations, please select your country/region of residence. If you do not select a country, we will assume you are from the United States. Select your Cookie Settings or view our Privacy Policy and Terms of Use.
Cookie Settings
Cookies and similar technologies are used on this website for proper function of the website, for tracking performance analytics and for marketing purposes. We and some of our third-party providers may use cookie data for various purposes. Please review the cookie settings below and choose your preference.
Used for the proper function of the website
Used for monitoring website traffic and interactions
Cookie Settings
Cookies and similar technologies are used on this website for proper function of the website, for tracking performance analytics and for marketing purposes. We and some of our third-party providers may use cookie data for various purposes. Please review the cookie settings below and choose your preference.
Strictly Necessary: Used for the proper function of the website
Performance/Analytics: Used for monitoring website traffic and interactions
Reveal Embedded Analytics Today’s business users expect more than static dashboards or delayed reports. That is the promise of self-serviceBI: giving users direct access to the answers they need without relying on data teams or filing support tickets. This is where embedded self-serviceBI comes in.
The great advantage of these tools is that they streamline the creation, distribution, and analysis of NPS surveys. Plus, the ability to create custom NPS dashboards allow you to analyze the results easily without writing a line of code. Leverage AI-driven sentiment analysis to analyze and categorize open-ended responses quickly.
Product Fruits for user analytics Product Fruits has minimal analytics features. For more detailed analytics, you’ll need the 2-way integration with third-party analytics tools like Mixpanel or HubSpot, which allows you to share and receive data. Basic analytics. No AI-based user sentiment analytics.
Every tool claims to be a no-code tool and easy to use, but few support the workflows product teams care about, like multi-step onboarding , flow targeting, mobile support, or analytics that go beyond step views. UserGuiding: Best for startups that need no-code onboarding flows and basic analytics. Starts at $300/month for 1,000 MAUs.
Our solution: AI-powered automation As the makers of many popular Atlassian apps like Just Add+ Embed Markdown, Diagrams & Code for Confluence and Notification Assistant for Jira Email , the volume of keyword-relevant threads to monitor is quite high. Implementing analytics to track community engagement trends. Heres what happened.
We examine both quantitative gains — such as higher customer satisfaction scores, rising self-service usage and digital adoption rates — and qualitative developments, including more personalized services, smarter virtual assistants and greater accessibility in digital banking.
While the product adoption platform offers decent user onboarding and engagement features, it lacks advanced analytics capabilities and is quite expensive. Lack of product analytics tools: Analytics capabilities are limited to tracking engagement with Chameleon-authored content. Have you been looking for Chameleon alternatives?
Microsoft Clarity – Suitable for SMBs with no heavy analytics needs – 100% free. Session replays are available across all plans for the first 5,000 sessions, but you can purchase more as add-ons if you’re on the Growth or Enterprise plan. G2 rating: 4.6/5 Shareable session replay: Yes. G2 rating: 4.5/5 Deployment: SaaS.
With Userpilots analytics, you can: Track how each user navigates your onboarding flows and where they drop off. All these insights appear in one unified dashboard, alongside your web analytics, so your team sees the entire user journey across platforms, including how marketing campaigns influence user behavior.
As a fellow PMM who’s been there, I can tell you that traditional analytics tools just don’t cut it anymore. That’s where Userpilot’s mobile analytics come in. Why choose Userpilot for mobile analytics? It’s built for product people who need clear insights without drowning in data.
A robust survey platform should be able to automate data collection, ensure data quality, and integrate results into your existing workflows or analytics platforms, making insights more actionable. When evaluating your options, look for a solution that balances ease of use with the power to scale and integrate across your business.
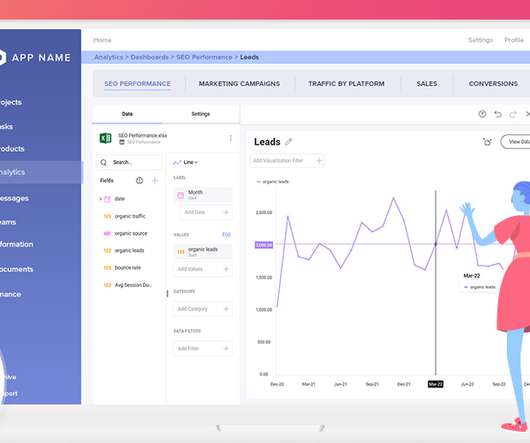
As you’re researching dashboardreporting tools, you’ve probably noticed how hard it is to find reliable information on the available solutions. To make your life a little bit easier and help you choose the best dashboardanalytics tool for your SaaS, we’ve produced a guide of 12 excellent platforms available on the market in 2024.
Today, Constellation Research , a leading technology research and advisory firm based in Silicon Valley, announced that Birst, an Infor company, for the fourth consecutive time, has been named to the Constellation ShortList for Cloud-Based BusinessIntelligence and Analytics Platforms.
PLG for enterprise? TL;DR We define product-led growth (PLG) as a business strategy that uses the product to boost its own growth. Unlike sales-led businesses, a product-led growth company relies on product virality to drive customer acquisition and frictionless experiences that enable users to realize the product value.
Reveal Embedded Analytics. By integrating an embedded analytics solution into your own software, SaaS, Angular application , or other apps, you can greatly improve your existing product’s value proposition. . Here, we’re going to cover all of the do’s and don’ts when embedding analytics into your applications. .
By analyzing user behavior patterns and uncovering valuable insights, behavior analytics tools enable businesses to design strategies that drive retention and business growth. Discover the cutting-edge of behavioral analytics tools! Behavior analytics tools empower companies to make effective, data-driven decisions.
Reveal Embedded Analytics. Embedding analytics into your Angular apps is a tremendous advantage for your business; it helps you gain valuable business insights from your data and grow your profits by guiding key business decisions. What Is BI? Why Should Your EmbedBI in Your Angular Apps?
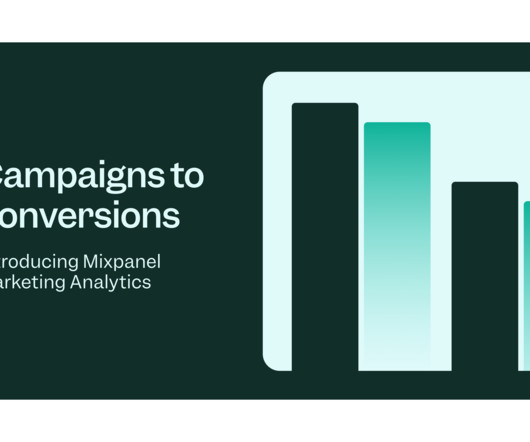
Mixpanel launched over a decade ago as an analytics tool for product teams. That makes it important to use the same analytics tool. Traditional marketing analytics tools were built for just the web, but marketing channels have evolved. That makes it important to use the same analytics tool. There are two reasons why.
They help small businesses and enterprises alike perform sophisticated tasks in just a few clicks, making it easier to drive product growth. Then read on to discover the top 20 cloud-based apps that will help streamline different parts of your business. Google Analytics is the best web analytics software.
It lacks analytics features, customization options, and overall it might not be worth the price for some companies. These already point out some problems: Basic analytics, so it’s challenging to compare multiple survey results based on different variables. Userpilot feedback analytics. Poor survey design options.
Using smart links, you can embed live data from multiple applications to the project pages in Atlas. According to Okta’s Business at Work report, companies with more than 2,000 employees deploy an average of 187 apps. Atlassian Data Lake — Simplifying Cross-Platform Analysis. Image Source: atlassian.com.
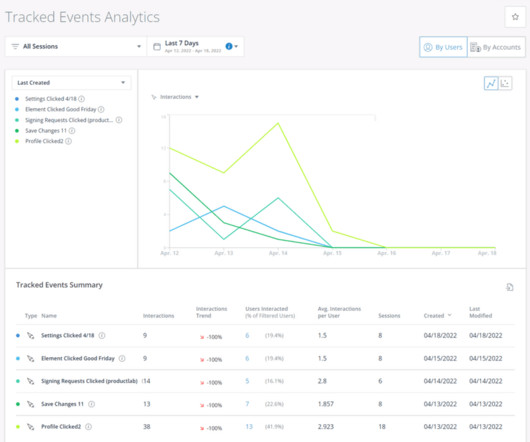
WalkMe supports analytics features such as Tracked Events, Session Streams, User Recordings, and AI Predictive Analysis to gain actionable insights into user in-app behavior. Userpilot is an alternative product adoption platform with better analytics and feedback features. The relevant features include: Management dashboards.
In this article, we look at 10 product analytics tools that you should consider when making your choice. HubSpot is a comprehensive marketing, sales, and customer service platform that allows you to optimize your sales and marketing funnel, with features like custom funnel reports and segmentation. Let’s get right to it!
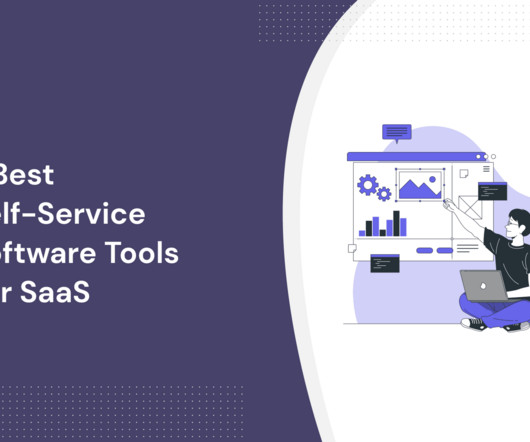
Having a hard time choosing the perfect customer self-service software? This article covers: Key benefits of the self-service method. Important features to look out for in a self-support tool. Good customer self-service portals help to: Answer customer queries instantly. Offer 24/7 support.
TL;DR Pendo Engage is a product adoption platform for with in-app guidance , product analytics, and feedback collection capabilities. The benefits of using Pendo Engage include its custom themes, flexible dashboards , multi-platform analytics, 50+ integrations, and the fact that you don't need to write any code to utilize its features.
Reveal Embedded Analytics. As a business owner or manager, it’s natural to want your business to run smoothly and efficiently. When it comes to embedded analytics a lot of business owners and managers use white labeling software that helps them build trustful and loyal relationships with their valuable customers.
In this article, you’ll learn: How to conduct churn analysis. Customer churn data tells you how many customers have stopped using your product or service over a period of time. Customer churn analysis is the process when you investigate why customers are churning and what could make them stay to improve user retention.
Looking for an effective selfservice support tool and wondering if Userlane is the best option for your SaaS company? In this article, we’ll delve into precisely that – helping you determine whether Userlane is the ideal choice for your selfservice support needs. What does self-service support entail?
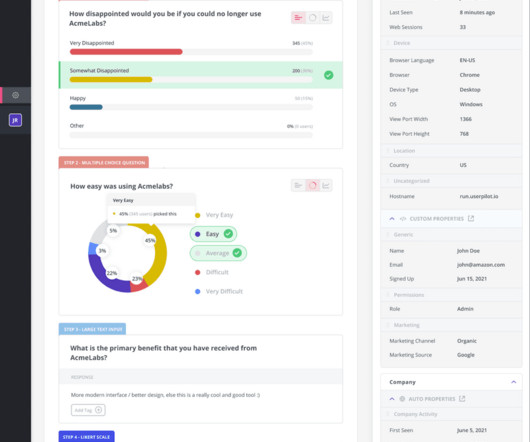
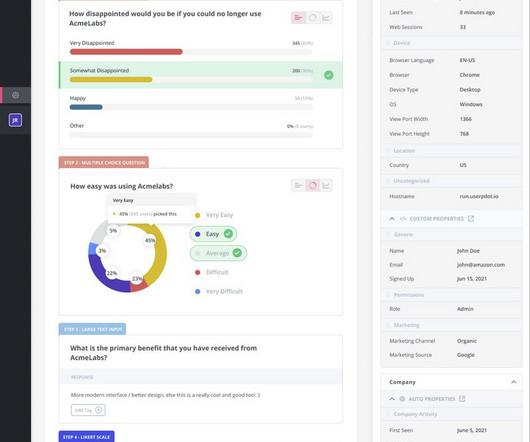
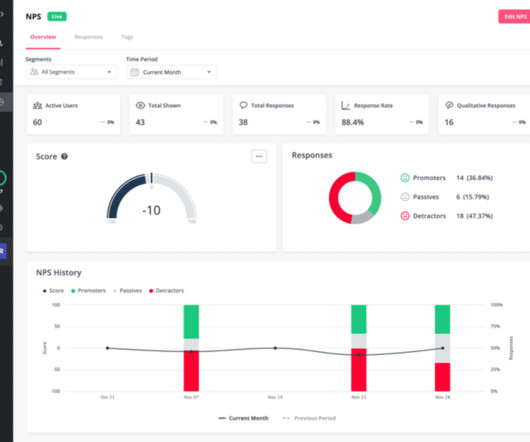
Userpilot NPS Dashboard. The real power of Userpilot surveys, however, lies in the built-in analyticsdashboard. In addition to a specialized NPS dashboard, you get a general dashboard for tracking, visualizing, and analyzing survey responses. Analyze survey responses on a simple dashboard.
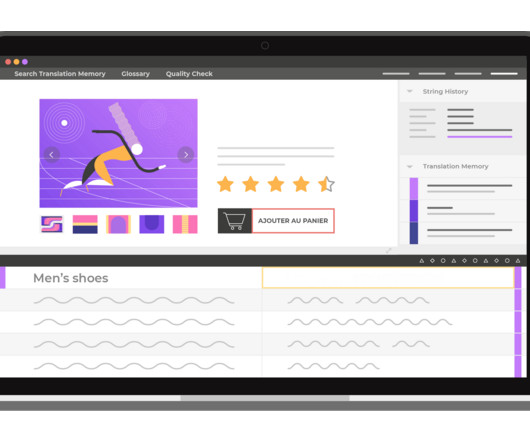
From content creation, localization, image and video generation, or analytics, today we’ll be looking at the best tools that can help streamline various processes in just a few clicks! AI tools can help you with content creation, image generation, localization, SaaS marketing, email automation, and data analysis.
Google Sheets Good for: Organization and analysis Cost: Free for the average user, monthly plans start at $5 GetApp (GA) rating: 4.7/5 Product managers seldom have direct reports, but they need to herd multiple teams with various objectives in the same direction. This means the most recent designs will show up live in the document.
You should consider the following: SMB or Enterprise? The size of your business will dictate how much budget you have available for customer service software, as well as the number of seats you’ll need to buy. Delighted Dashboard. It also comes with a suite of analytics tools to process the customer feedback you receive.
Notebooks are available to all organizations on the Growth, Enterprise, and Scholarship plans. What observations prompted doing this analysis or running this experiment in the first place? Explain the set up of the experiment or analysis, including what users you were looking at and in which time frame. When to make a Notebook?
get ratings of your products or services. streamline your customer service and shorten response times. A user feedback widget can link to anything from a very simple on-site poll, one-question survey, and star rating, to visual feedback and complex feedback analysis platform. The tool also offers real-time analysis.
get ratings of your products or services. streamline your customer service and shorten response times. A user feedback button can link to anything from a very simple on-site poll, one-question survey, and star rating, to visual feedback and complex feedback analysis platform. The tool also offers real-time analysis.
Looking for an effective user engagement analysis tool and wondering if Userlane is the best option for your SaaS company? In this article, we’ll delve into precisely that – helping you determine whether Userlane is the ideal choice for your user engagement analysis needs. Let’s get started!
Looking for an effective user engagement analysis tool and wondering if Userlane is the best option for your SaaS company? In this article, we’ll delve into precisely that – helping you determine whether Userlane is the ideal choice for your user engagement analysis needs. Let’s get started!
Looking for an effective user behavior analysis tool and wondering if Userlane is the best option for your SaaS company? In this article, we’ll delve into precisely that – helping you determine whether Userlane is the ideal choice for your user behavior analysis needs. Looking for a Better Alternative for User Behavior Analysis?
As we indicated in our previous blog, AIOps (Artificial Intelligence for IT Operations) refers to the application of machine learning analytics technology that enhance IT operations analytics. So eG Enterprise uses a variety of mechanisms to interface with the applications and infrastructure being managed.
HubSpot provides tools for quantitative analysis of the results and you can view individual survey responses. HubSpot surveys require a paid subscription to the Service Hub, starting from $450/month for the Professional plan. When it comes to the design , you can embed your own featured image and choose a color of your choice.
I’ll also cover how eG Enterprise offers out-of-the-box functionality to avoid complex JSON scripting or tooling to implement monitoring. Implementing Alerting, Reporting and Dashboards. Out-of-the-box Dashboard. Alert and Event Correlation and Root-Cause Analysis. Installing a CloudWatch Agent for Better Insight.
Because of how important omnichannel communication is to the overall customer experience, we built an enterprise integration between Userpilot and Salesforce to bridge the gap between your SaaS product and CRM platform. Omnichannel communication strategies also prevent the formation of data silos across different customer touchpoints.
TL;DR Kompassify is a cloud-based, no-code client onboarding tool for small and midsize businesses. The no-code approach makes it great for non-technical teams to do product tours, checklists, walkthroughs, progress tracking, and real-time analytics. Survey Analytics On Kompassify teams can create Net Promoter Score (NPS) surveys.
You might need an alternative solution to UserGuiding if you fall into any of the following use cases: Advanced analytics : If you’re looking for a product adoption platform with full-suite native analytics then you’ll likely need to look at platforms like Userpilot or Appcues that are better suited to your needs.
We organize all of the trending information in your field so you don't have to. Join 96,000+ users and stay up to date on the latest articles your peers are reading.
You know about us, now we want to get to know you!
Let's personalize your content
Let's get even more personalized
We recognize your account from another site in our network, please click 'Send Email' below to continue with verifying your account and setting a password.


Let's personalize your content