This site uses cookies to improve your experience. To help us insure we adhere to various privacy regulations, please select your country/region of residence. If you do not select a country, we will assume you are from the United States. Select your Cookie Settings or view our Privacy Policy and Terms of Use.
Cookie Settings
Cookies and similar technologies are used on this website for proper function of the website, for tracking performance analytics and for marketing purposes. We and some of our third-party providers may use cookie data for various purposes. Please review the cookie settings below and choose your preference.
Used for the proper function of the website
Used for monitoring website traffic and interactions
Cookie Settings
Cookies and similar technologies are used on this website for proper function of the website, for tracking performance analytics and for marketing purposes. We and some of our third-party providers may use cookie data for various purposes. Please review the cookie settings below and choose your preference.
Strictly Necessary: Used for the proper function of the website
Performance/Analytics: Used for monitoring website traffic and interactions
Leveraging product analytics isnt just about making pretty dashboards; its about viewing your existing data as a learning opportunity to make informed decisions with your onboarding strategy. At Userpilot, we create quarterly dashboards organized by release. These dashboards dont just collect numbers; they tell a story.
In this blog, you’ll learn: What brand health tracking is and why it’s essential for modern brands The key metrics that reveal brand awareness, loyalty, and competitive positioning Best practices for consistent, high-quality tracking and reporting A phased approach to launching and optimizing your tracking program Let’s break it down.
Turning Strategy Into Outcomes: Influencing Stakeholders To Achieve Alignment By Erica Wass At a Glance This blog outlines how successful product strategy depends on aligning cross-functional stakeholders, not just building a strong plan. Use dashboards to track actuals against forecasts in real time, highlighting variances early.
In this blog, were diving into actionable tips, examples, and templates to help you craft release notes that educate, inspire, and drive adoption. People consume updates differently, so you need to meet them where they arewhether thats inside your app, in their inbox, through your blog, or even on social media.
According to Harvard Business Review, 80% of new products fail, primarily because companies fail to conduct proper customer research. E.g., Identify navigation issues in your analytics dashboard based on real-time user interactions. Regularly read industry blogs, research reports, and news websites, like Statista, Nielsen, or Gartner.
Delta is the next generation of beta testing, leveraging Centercode technology to automate time consuming tasks while increasing user engagement and test results. Connect the Tools Set up alerting or dashboards in shared tools like Jira, Slack, Zendesk, or Centercode. This guide has all the answers.
Things seem great initially, but soon enough, you see your analytics dashboard showing a constant decline. Frequent app crashes: Technical glitches or slow load times disrupt the user journey. You can spot and address these issues early by actively tracking reviews, support tickets, and usage data at each step of the user journey.
Manual bottlenecks: Code reviews, security checks, and deployments still require too much human intervention, causing delays. AWS Security Hub can aggregate security data from multiple sources and provide you with a centralized dashboard for identifying and mitigating threats.
✅ This guide was written by Alex Reyes , a senior technical recruiter with 20+ years of experience. Includes : Real take-home case studies, technical and dashboarding skills, and strategies from interviewers at top tech companies. ✅ Technical depth and business acumen demonstrated throughout.
Known as the Martech 5000 — nicknamed after the 5,000 companies that were competing in the global marketing technology space in 2017, it’s said to be the most frequently shared slide of all time. Marketing technology is now the largest portion of total marketing budget (29% on average according to Gartner ).
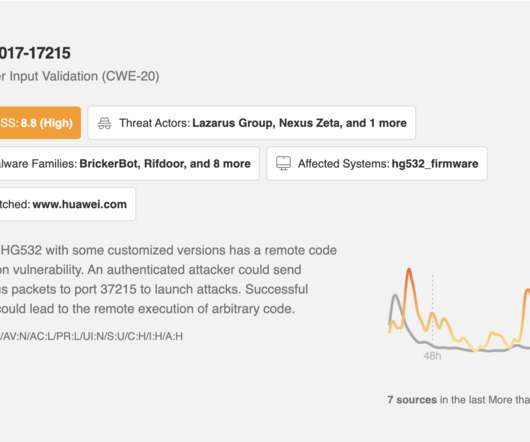
The Leo CVE Dashboard gives you at-a-glance visibility into relevant trending vulnerabilities, and you can use Leo to focus any of your feeds for faster insight into risks impacting your business’s software, hardware, and application stack. All of this information is available at a glance via the Leo CVE Dashboard and throughout your Feeds.
Between the message boards, subreddits, and blogs, chances are you can find your existing online communities directly in your niche. To make your job a little easier, we’ve curated a list of resources to the submission processes of the three most popular app stores: Apple App Store Review Guidelines.
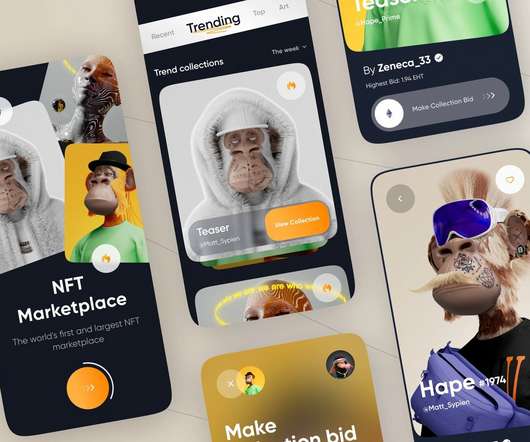
This blog will be sharing some of the most informative and interesting development of web3’s favorite NFT marketplace. This is possible due to the credibility of the flexibility of the blockchain technology used. A number of the items accessible in the dashboard are the NFT price list, NFT description, NFT Categories, etc.
To cut the long story short, we decided to build an Ad-Tech product that will aggregate all the Ad channels, DSPs we use to make the entire process much easier for the team and the client-side. Fast forward to a month after, I had completed the documentation and we’re ready to build our first tech product. Let’s start building ??
TL;DR A marketing tech stack is any combination of software tools that marketing teams use to improve their campaigns. The typical marketing technology stack is made up of tools from different categories. Search Engine Optimization Tools that help with optimizing content, keyword research , and technical aspects.
That’s exactly what we explore in our review. Retroactive analytics Retroactive analytics enables non-technical product teams to track user behavior data without any coding. G2 reviewers give Pendo an average rating of 4.4 Pendo review. Pendo review. But does the free plan live up to the expectations?
The research process for even small purchases can be long and difficult: there are reviews to read, content to consume, docs to check, and questions to be asked. Blog posts. For example, if a customer contacted you with a question about the ingredients in your all-natural body lotion, you might send them to a blog post on the subject.
UserGuiding dashboard. After publishing your content, you can see all user interactions related to it on the analytics dashboard. UserGuiding analytics dashboard presents information from different content, like guides, hotspots, checklists, and resource centers, in one place. Reviews about UserGuiding. Let’s see.
What Technology Do You Need in Your Stack? As technology develops, analytics stacks become easier to set up, manage, and scale. The technology you choose will help you navigate your business into the future. However, due to greater flexibility, more engineering investment is required during setup and maintenance.
Wondering what the Technology Adoption Curve is? The technology adoption curve shows the distribution of users depending on how quickly and easily they embrace technological innovation. The technology adoption curve shows the distribution of users depending on how quickly and easily they embrace technological innovation.
Their tightly packed visual dashboards organize the data in a way that makes it easy to map out sales funnels, track common paths, uncover behavior patterns, and identify friction points. While FullStory works for mobile apps, the web/mobile hybrid platform doesn’t cover every framework, particularly with non-native tech stacks (e.g.
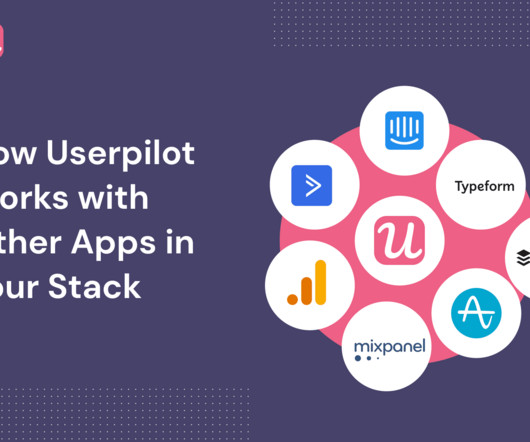
If you’re looking for the technical documentation on Userpilot integrations, go here. Enable Userpilot integrations in one click directly from your dashboard with: Segment , Amplitude , Google Analytics , Google Tag Manager, Heap, Intercom , Kissmetrics, Mixpanel. Need help with enabling an integration? Userpilot help center.
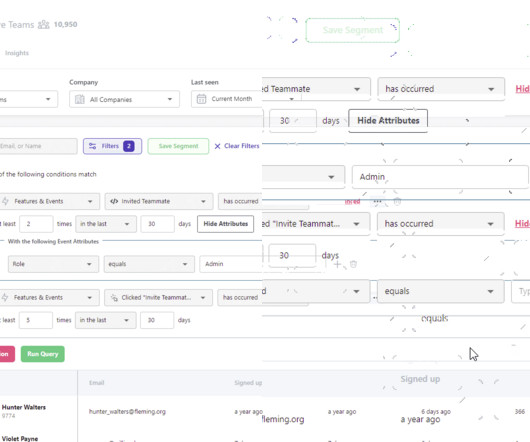
5 rating on the review site G2. Heap G2 review. I’ve reached out to CX about this and their response has been that there’s simply too much data for the query to run successfully… G2 review. Userpilot Features & Events dashboard. What do users say about Heap? Heap boasts a solid 4.3/5
From your dashboard, you’ll be able to see your own tasks and organize them however you’d prefer. Aericon has a post on its blog about how they use Asana for product management – we here at UserVoice are also a fan of keeping tabs on marketing projects via Asana. Costs Vs Benefits.
If you don’t know it already, Mode is a data science platform that brings together a SQL editor, Python notebook, and R where you can perform data visualization, create charts and dashboards, and then share your analysis with a click. A large part of the reason is due to the fact that not everything is measurable. 4 Data Elixir.
To help you make a decision, in this blog, we will go over the specifics of A/B tests in Mixpanel, uncover its pros and cons, and introduce you to a better alternative. You can analyze Mixpanel A/B testing results using analytics dashboards , funnel analysis , and customer segmentation. Run the test and analyze the results.
SaaS is regarded as the technology most crucial to corporate success. Given that smaller companies now have access to powerful software that is not only pricey but also impossible to buy through traditional methods due to financial restrictions, SaaS is a true blessing for small firms. The SaaS market has increased from $31.5
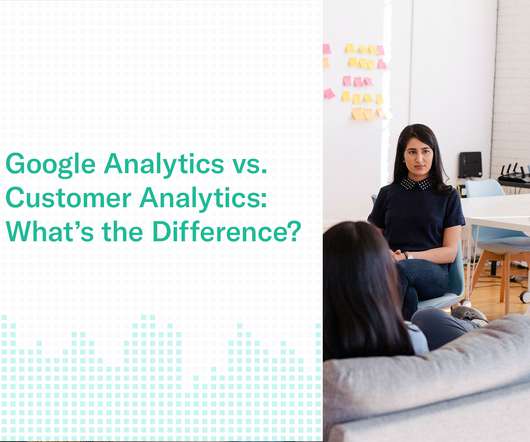
When you install Google Analytics on your website, you gain access to a basic data-dashboard in exchange for sharing insights with Google. To create this framework, you will likely need to work with an analytics consultant and/or technical specialist. Technical Snapshot: Google Analytics vs Customer Analytics.
A well-designed dashboard should provide users with easy access to predictions, historical performance data, and personalized settings. To achieve this balance, consider leveraging cloud computing and distributed processing technologies to speed up computations. Implement a transparent content review and moderation process.
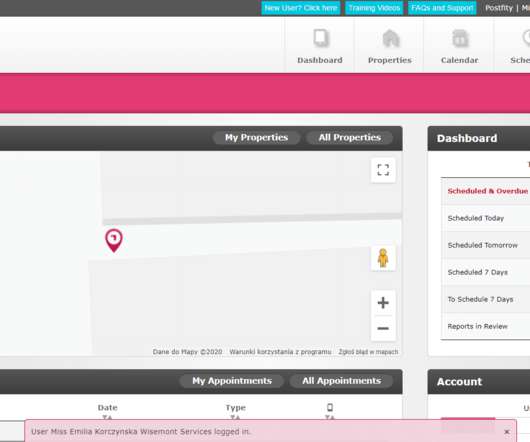
With a complex product consisting of both a desktop dashboard and a mobile app for Real Estate agents, Rachel Lightfoot, a co-founder and product manager at Touchright – struggled with user onboarding and activation. This requires a lot of technical knowledge to just get started. Sign up for Userpilot demo today! Conclusion.
A couple of months ago, we reviewed the new Firefox browser designed for developers. And all created screenshots and screen recordings are directly stored in your project dashboard, making bug tracking and feedback a lot of fun! It uncovers technologies and. Identify web technologies with Wappalyzer. Link: Hiver.
For additional information, you might like to read Barry Schiffer’s blog on this functionality [link] or the documentation on Remote Control Actions [link]. Yes, eG Enterprise supports monitoring of Nutanix AHV and we are a Nutanix technology partner. What is [eG’s] Standard SLA for technical help required for customer?
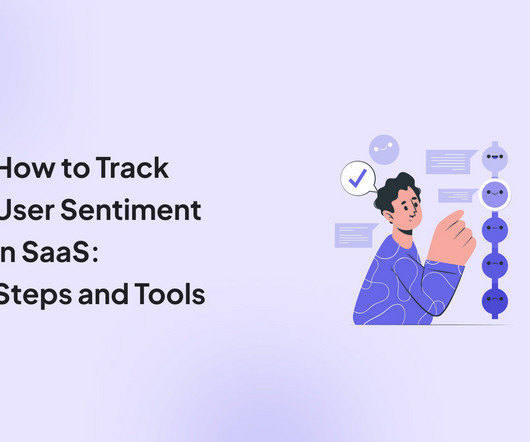
What if we told you you could track user sentiment in the user feedback , social comments, and online reviews you receive? To analyze customer sentiment accurately, these tools dig into a text (social media posts, user reviews , messages, etc.) These could be posts on social media channels or third-party review websites.
What about software solutions they have to review based only on a single web page? A SaaS solution is easy to use if non-technical employees can learn it intuitively, with minimum support. Video content and customer reviews (ideally the two combined) are the best at conveying the “this software is easy to use” message.
We’ll explore its features, pricing, and offer a comprehensive review to aid in your decision-making process. If your team members come from non-technical backgrounds, they might struggle to use Heap to the fullest. You can access this raw data on your Heap dashboard and label the most relevant events.
The customer support team should be there throughout the entire customer onboarding journey to help users with any technical snags, one-on-one training, or product documentation. You can also look at in-app user behavior, engagement rate, and the level of tech-savviness of your users to personalize onboarding. Customer success.
We’ll explore its features, pricing, and offer a comprehensive review to aid in your decision-making process. If your team members come from non-technical backgrounds, they might struggle to use Heap to the fullest. You can access this raw data on your Heap dashboard and label the most relevant events. Segmenting on Heap.
We’ll explore its features, pricing, and offer a comprehensive review to aid in your decision-making process. If your team members come from non-technical backgrounds, they might struggle to use Heap to the fullest. Here’s how you can do that: Head to the Data section in your Heap dashboard and select Segments.
Product analytics software varies but most have similar features, such as data capturing, customized segmentation, and KPI dashboards. KPI and other custom-built dashboards. Heap’s dashboard. Amplitude’s dashboard. How Product Marketing Managers use product analytics. Tracking custom events. Data funnels. 1 – Heap.
Looking for an in-depth review of UserGuiding pricing so you can understand whether it’s the right choice for you? Although review sites and word-of-mouth can help you narrow down your choices, they can fail to help you make the right decision. UserGuiding’s dashboard. Review quotes on UserGuiding.
We’ll explore its features, pricing, and offer a comprehensive review to aid in your decision-making process. If your team members come from non-technical backgrounds, they might struggle to use Heap to the fullest. Under the Data tab of your Heap dashboard, you can access raw event data. Let’s get started!
Marketing Resource Management (MRM) refers to a set of marketing technologies and processes focused on streamlining and centralizing marketing assets, operations, workflows, and information into a single system. Organize project requests, reviews, approvals, communications, and proofing in one system for better efficiency and clarity.
We’ll explore its features, pricing, and offer a comprehensive review to aid in your decision-making process. If your team members come from non-technical backgrounds, they might struggle to use Heap to the fullest. As you give it a name, you can see all the details relating to the event in Heap’s Explore event dashboard.
We’ll explore its features, pricing, and offer a comprehensive review to aid in your decision-making process. If your team members come from non-technical backgrounds, they might struggle to use Heap to the fullest. Under the Data tab of your Heap dashboard, you can access raw event data. Let’s get started!
We organize all of the trending information in your field so you don't have to. Join 96,000+ users and stay up to date on the latest articles your peers are reading.
You know about us, now we want to get to know you!
Let's personalize your content
Let's get even more personalized
We recognize your account from another site in our network, please click 'Send Email' below to continue with verifying your account and setting a password.


Let's personalize your content