This site uses cookies to improve your experience. To help us insure we adhere to various privacy regulations, please select your country/region of residence. If you do not select a country, we will assume you are from the United States. Select your Cookie Settings or view our Privacy Policy and Terms of Use.
Cookie Settings
Cookies and similar technologies are used on this website for proper function of the website, for tracking performance analytics and for marketing purposes. We and some of our third-party providers may use cookie data for various purposes. Please review the cookie settings below and choose your preference.
Used for the proper function of the website
Used for monitoring website traffic and interactions
Cookie Settings
Cookies and similar technologies are used on this website for proper function of the website, for tracking performance analytics and for marketing purposes. We and some of our third-party providers may use cookie data for various purposes. Please review the cookie settings below and choose your preference.
Strictly Necessary: Used for the proper function of the website
Performance/Analytics: Used for monitoring website traffic and interactions
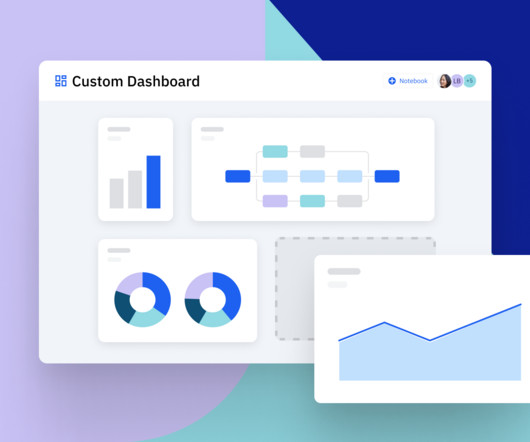
Reveal Embedded Analytics We know how difficult it is to create dashboards, especially for web applications. Thats what dashboards are for. In fact, Angular dashboards can provide key insights that will eventually allow data-driven decision-making at your company. It offers several options when it comes to dashboard libraries.
Are you wondering how the new Userpilot custom analytics dashboards can help you drive product growth? In this article, you will learn about the main benefits of custom product analytics dashboards and how to create them in Userpilot. TL;DR Userpilot custom analytics dashboards allow you to display multiple reports in one place.
Would you like to learn how to design a SaaS metrics dashboard for your team without any coding? In the article, you will find examples of various SaaS dashboards and learn how to create them with Userpilot analytics. In Userpilot, click Dashboards in the menu and click the ‘ Create New ’ button. Let's dive in, shall we?
Build your first analytics dashboard by following our step-by-step guide that explains what makes an effective analytics dashboard and how to implement it.
Speaker: Miles Robinson, Agile and Management Consultant, Motivational Speaker
Join Miles Robinson, Agile and Management Consultant, as he covers five key considerations for you to keep in mind when you’re updating your software or app to offer the latest in embedded dashboards. You’ll leave with a better understanding of where to begin on creating actionable, insightful dashboards.
Custom dashboards to track key metrics at a glance. Pendo The dashboard on Pendo. Additional reports: You get a built-in Product Engagement Score dashboard. Lack of templates: There arent many ready-to-use dashboards or templates to get started quickly. UserGuiding dashboard. Whatfix dashboard.
Plus, the ability to create custom NPS dashboards allow you to analyze the results easily without writing a line of code. Get real-time access to customer feedback via a centralized dashboard that updates as responses come in. Visualize detailed reports with advanced data segmentation and dashboards.
Based on your current dashboard, it looks like most users churn before completing onboarding. Bad data leads to bad decisions, whether that means duplicated records, misfired onboarding flows, or false signals in your dashboards. Start by creating a public dashboard that highlights shared metrics across teams.
Example: Imagine you’re designing a new dashboard for a fintech app. Example: For our dashboard, we might ask, “How might we create a dashboard that helps analysts quickly spot trends and take action?” Example: Imagine you’re designing a new dashboard for a fintech app. Big difference, right?
Speaker: Laura Klein, Principal at Users Know and Author of UX for Lean Startups
That's why Laura Klein, product manager and UX designer, has a set of tips to help application teams improve their embedded dashboards and reports. No one makes poorly designed products on purpose. And yet we have so many of them in our lives.
Reports & analytics : Provide tailored analytics, dashboards, and reporting capabilities to track customer engagement, identify trends , and enable data-driven decision-making for improved customer success. Reporting and dashboards for outcome tracking. Reporting and dashboards for keeping a real-time pulse on customer sentiment.
A dashboard showing metrics like feature adoption or user engagement amplifies your credibility. How to Get Started: Create Dashboards: Track key metrics like churn, engagement, or feature adoption that align with business goals. Communicate Progress Early: Regular updates on winsno matter how smallbuild trust and momentum.
With the product usage dashboard, you can track user engagement metrics, popular pages and features, top interactions, trends, and even browser preferences. Know what you’re looking for before you start looking Dashboards have been a fad in the SaaS sphere for a while now. And the concept of diminishing returns sets in.
Dashboard : Customize the analytics dashboard or choose from pre-built ones to easily visualize and compare key metrics over time. Userpilot’s customizable analytics dashboards make metric tracking easier, enabling teams to track changes in performance, user behavior, and engagement at a glance.
The evolution of dashboards to automated business monitoring. Why automation elevates - not replaces - your embedded dashboards Download to learn: 5 business benefits of automated data discovery with ABM. How automated business monitoring separates insights from noise.
You can build your own custom charts and dashboards to see the metrics that matter in a single view, and access more of the data you need to measure team performance and improve operational efficiency. With custom reports, now you can track industry-standard metrics beyond pre-built dashboards.
Problem Brief Over a span of 4 weeks, we tested Civians platform and created design solutions to improve the overall user experience of the dashboard. We also encouraged them to think out loud while they were navigating the dashboard, to help us uncover their mental model and identify hidden insights.
Real-time analysis helps respond to trends as they arise, with dashboards visualizing results for quick, data-driven decisions. Automating Data Collection and Analysis Modern survey tools automate data collection and analysis, enabling efficient feedback gathering without manual labor.
Creating an expansion revenue dashboard with Userpilot without coding. It offers features like auto capture, dashboards, and reporting tools (cohort, path, and funnel analysis) that allow you to perform granular user analysis—helping you quickly identify trends and areas for improvement without coding.
Embedding dashboards and reports aren’t enough. Futureproof your application by offering instant, actionable insights that will give you and your customers a competitive advantage.
Even if you are used to dashboards, not every outcome is measurable, and you must not confuse the outcome with your progress monitoring. That’s true in general, and planning for outcomes makes it even more difficult. Outcomes, even when well-defined, are more abstract by nature.
Well, you can easily track the metrics from one of Userpilot’s analytics dashboards. There’s a ready-to-use Expansion Revenue & Upgrades dashboard, and you can create custom ones, too. Expansion Revenue & Upgrades dashboard in Userpilot. That’s a lot to keep a pulse on, isn’t it?
This insight could lead to implementing shared dashboards or concise weekly recaps, fostering clearer communication and smoother collaboration. Instead of jumping to add more meetings, asking, What information is getting lost? or How can we make updates easier to access? might reveal that key updates are being buried in email threads.
Say I was to start the development of my healthy eating product, I would copy the product goal “Help the users understand their eating habits and acquire an initial user base” into the product backlog together with the features “healthy eating dashboard” and “integration with smart watches and fitness devices.”
But today, dashboards and visualizations have become table stakes. Think your customers will pay more for data visualizations in your application? Five years ago they may have. Discover which features will differentiate your application and maximize the ROI of your embedded analytics. Brought to you by Logi Analytics.
The team should decide on alternative ways of surfacing the information in the alert in these situations, for example, a Slack or dashboard notification, or an opened task in an issue-tracking mechanism. If it is actionable, is there a dashboard link and does it show all known potential causes?
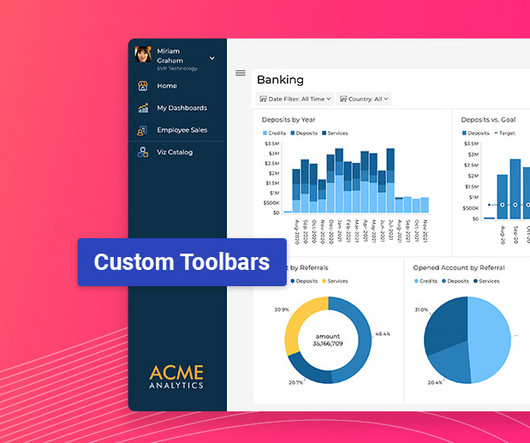
Latest Update Features: Custom Toolbars: Full control over dashboard menus. Custom Toolbar Options: Full Control Over Menus Developers can now fully customize dashboard and visualization toolbars using the revealView.onMenuOpening event handler. Interactive Filtering: Compare data instantly. Axis Title Control: Sharpen data clarity.
Whether its customer feedback, analytics dashboards, or training in decision frameworks, make sure they have what they need to succeed. Use this insight to refine your approach. Empower with Data and Tools Equip your teams with the resources they need to make informed decisions.
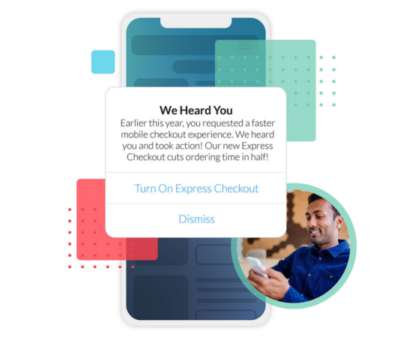
Response Targeting enables you to close the feedback loop at scale, accomplished entirely from within the Apptentive dashboard. Modernized, WCAG-Compliant Interactions. Apptentive SDK 6.0 also comes with new default UI styles for all consumer-facing Apptentive interactions, including the Love Dialog, Surveys, Notes , and Message Center.
As the analytics landscape has evolved, application teams who need to embed dashboards, reports, and other analytics capabilities in their commercial and corporate applications can choose from dozens of solutions. How do you differentiate one solution from the next?
E.g., Identify navigation issues in your analytics dashboard based on real-time user interactions. Userpilot is one answer, offering data collection and analytics features for quantitative and qualitative data, along with a custom analytics dashboard for visualizing your unique data and responses. Dashboard example in Hotjar.
Inefficient dashboard configuration Traders often leverage dashboards to monitor data from personal accounts, control transactions and contracts, follow the latest currency market trends and shifts. To increase working efficiency, users can tweak dashboards and choose the most topical tabs. And here’s when UX testing steps in.
Real-World Example If product analytics shows a high abandonment rate during a workflow, you might embed a dashboard or visualization that makes the workflow clearer. After implementation, product analytics tracks how users interact with the embedded features, giving you continuous feedback to refine and optimize.
DESIGN A DASHBOARD FOR RECORDING AND ANALYZING YOUR METRICS AND KPIS. This performance dashboard lays out all of your metrics in one place to keep you both goal-oriented and accountable to your success metrics. CONTINUE TO ADD TO YOUR PERFORMANCE DASHBOARD.
When your customers come to your app, what do they see: clunky, outdated dashboards or a sleek, modern interface? This e-book details a number of graphics libraries plus a few bonus tools to modernize your embedded dashboards.
Factors I consider when evaluating customer analytics tools Important core features Analytics dashboards : Provide real-time visualizations of key performance indicators (like active users and page views) at a glance, so you can easily track changes. Example of a Userpilot dashboard showing free trial to paid user conversion rate.
Autocapture events dashboard in Userpilot. Custom dashboards: Custom dashboards help you gather crucial metricslike average session duration, recurring revenue, or funnel conversions all in one place. Build and view custom dashboards in Userpilot. Example of DebugBears dashboard. Example of Datadogs dashboard.
Chargebee dashboard for tracking customer behavior (and measuring retention). These platforms allow you to track active subscriptions, cancellations / churned customers, and new sign-ups. The process of extracting a number of customers will be slightly more complex than with CRM, but at the end of the day, you will be able to calculate CRR.
A typical workflow involved looking at a dashboard full of charts with metrics sliced and diced by various attribute combinations. A typical operational dashboard we used before doubling down on traces. Armed with our own definition of observability, we assessed our existing practices and formulated a problem statement. Why traces?
Unlike smaller organizations, where basic BI features and simple dashboards might suffice, enterprises must manage vast amounts of data from diverse sources. Large enterprises face unique challenges in optimizing their Business Intelligence (BI) output due to the sheer scale and complexity of their operations.
It turns out it was over 35 forms that were riddled with conditional logic, a redundant backend ticketing system, several dashboard views and needed to cater to a myriad of job functions. I initially thought ticketing was made of a few components, a couple forms and one or two workflows.
image resizing, multi-page dashboards) with simple UIs. It can build web apps using both JavaScript and Python frameworks and particularly excels at building internal admin tools (e.g. file conversion, job applicant tracking) and data-driven applications (e.g.
Analytics Which platform gives teams the clearest insights without drowning them in dashboards? Its the self-serve analytics platform that transforms raw numbers into intuitive dashboards. The platforms real-time performance dashboards highlight not just whats happening, but why its happeningso you can course-correct on the fly.
But today, dashboards and visualizations have become table stakes. Think your customers will pay more for data visualizations in your application? Five years ago, they may have. Turning analytics into a source of revenue means integrating advanced features in unique, hard-to-steal ways.
We organize all of the trending information in your field so you don't have to. Join 96,000+ users and stay up to date on the latest articles your peers are reading.
You know about us, now we want to get to know you!
Let's personalize your content
Let's get even more personalized
We recognize your account from another site in our network, please click 'Send Email' below to continue with verifying your account and setting a password.


Let's personalize your content