article thumbnail

Product Update: December 2020

Indicative

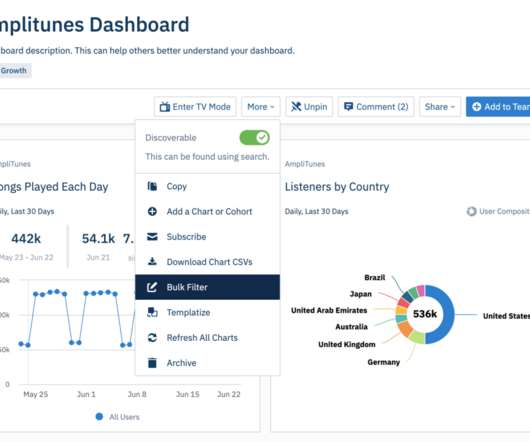
2020 was a year of growth and transformation for Indicative. Embedded Widget and Public Dashboard Variant Creation API. Advanced users can now apply select filters to an embedded widget or public dashboard, enabling filtered variants using a secure API. The post Product Update: December 2020 appeared first on Indicative.

article thumbnail

Product Update: September 2020

Indicative

Query notes can be viewed in the query itself, or when your query is saved as a bookmark or to a dashboard. To use query notes, select the pencil icon to the right of the query builder or on a dashboard, open Widget Settings, then select Edit Query Notes. The post Product Update: September 2020 appeared first on Indicative.

Insiders

Sign Up for our Newsletter

This site is protected by reCAPTCHA and the Google Privacy Policy and Terms of Service apply.

Trending Sources

article thumbnail

Release Notes: July 2020

Amplitude

Today we are thrilled to announce the release of Templates, a workflow tool to leverage your existing Amplitude dashboards to empower new teammates, and apply previous work to new product initiatives. Public links allow you to share charts and dashboards without granting the viewer full access to your Amplitude org. New in Analytics.

article thumbnail

Release Notes: June 2020

Amplitude

Visit our docs , or watch this demo to see how it works: Historical Count. Share bulk dashboard filters. Bulk Dashboard Filters temporarily update all charts on a dashboard with alternate date ranges, intervals, or user segments. Available on the Enterprise, Growth, and Scholarship plans. Available on all Amplitude plans.

article thumbnail

Digital Analytics 101: What Is It and How to Collect Digital Data?

Userpilot

For example, if you know your demo conversion rate , you’re able to predict how many leads will turn into paying customers and how much they’ll spend. If you want to see how Userpilot can help you leverage digital analytics to make informed product decisions, book the demo! Digital analytics tools: Google Analytics.

article thumbnail

There Is No One-Size-Fits-All: Ways to Apply Cloud eCommerce Solutions

The Product Coalition

The global eCommerce market reached 34% in 2020 owing to the covid-19 outbreak. Show results such as during demos, etc. Develop operational dashboards. Business-to-business eCommerce statistics continue growth in 2022. We predict B2B eCommerce site sales will reach nearly $ 1.77 trillion (2022), a 12% increase from 2021.

article thumbnail

Data-Backed Productivity Tips for the Gaming Industry

Indicative

According to a 2020 survey from the Game Developers Conference (GDC), 62 percent of respondents said that they spend more than 46 hours per week on the job. . One way to bring these analyses together is through a comprehensive dashboard like the one below. Sign up for an interactive demo, in a few simple steps, here.