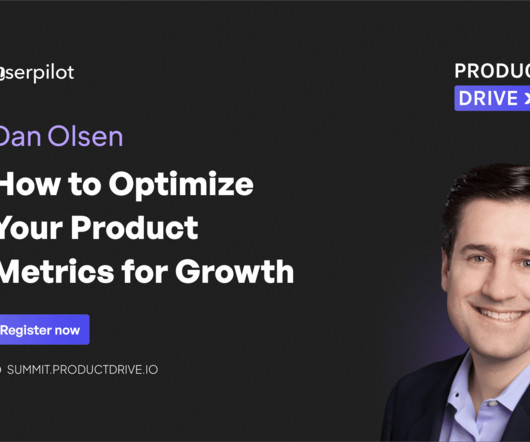
This site uses cookies to improve your experience. To help us insure we adhere to various privacy regulations, please select your country/region of residence. If you do not select a country, we will assume you are from the United States. Select your Cookie Settings or view our Privacy Policy and Terms of Use.
Cookie Settings
Cookies and similar technologies are used on this website for proper function of the website, for tracking performance analytics and for marketing purposes. We and some of our third-party providers may use cookie data for various purposes. Please review the cookie settings below and choose your preference.
Used for the proper function of the website
Used for monitoring website traffic and interactions
Cookie Settings
Cookies and similar technologies are used on this website for proper function of the website, for tracking performance analytics and for marketing purposes. We and some of our third-party providers may use cookie data for various purposes. Please review the cookie settings below and choose your preference.
Strictly Necessary: Used for the proper function of the website
Performance/Analytics: Used for monitoring website traffic and interactions
According to product expert Dan Olsen , it’s because their “bucket” — the product itself — is leaky. Dan, a Stanford-trained engineer with experience guiding companies like Intuit, understands how to optimize your productmetrics for growth by focusing on retention and building a product users truly value.
In the latest TPG Live session, Driving Impact Through Influence and Experimentation , we dived into strategies product managers can use to expand their influence, foster innovation, and navigate the evolving landscape of product management. Navigating Pushback Resistance to experimentation is a common challenge for product managers.
Onboarding gamification is the key to transforming a dull process into an engaging one. When the process feels complicated, it becomes easy for a new user to lose interest before they experience the true value of your product. What is onboarding gamification? Launching a new product. Why use a gamified onboarding process?
Ever wonder why some products instantly click with users while others get abandoned faster than New Year’s resolutions? The secret often lies in those crucial first moments – your user onboarding. Well, when onboarding new users, that approach is about as effective as trying to fit everyone into the same pair of pants.
So, how do you get started with product analytics ? In this article, we’ll talk about: What product analytics is and why you need a solid strategy. Key steps to build and improve your product analytics strategy. How to apply actionable metrics to different SaaS business stages. What is product analytics?
Our industry is in the midst of a big philosophical debate about the fundamental way of thinking about how we build our products, with the focus shifting from the outputs of what we build to the business outcomes generated by those outputs. The Product Impact Framework felt like a natural progression from features to outcome.
Thats why you need user session analysis. By combining contextual insights from session replays , heatmaps, and behavior analytics, user session analysis helps you interpret metrics through the lens of real user journeys. Imagine a product team celebrating a 200% spike in sign-ups after a promotional campaign.
With an abundance of product analytics to track, having a robust SaaS KPI dashboard is essential to monitor the metrics that matter most. TL;DR A SaaS dashboard can be used to track important metrics and key performance indicators. What is a SaaS KPI dashboard? Let’s get into it! Usage monitoring.
Guest Post by: Marvin Mathew (Mentee, Session 11, The Product Mentor) [Paired with Mentor, Jordan Bergtraum]. Ruthless prioritization translates to product teams spending time building the right thing at the right time. Product: What are the key metrics that we’re tracking? Each feedback loop has a minimum of four stages.
For me, effective mobile app onboarding is the difference between new users looking around our app and disappearing right after, or understanding our app value and becoming engaged users. To succeed, therefore, you need to create a frictionless mobile app onboarding flow that captures users attention and shortens their time to value.
Without measuring and aggressively improving the right mobile app metrics, youll struggle to stay afloat. This article will cover 14 metrics to help you achieve just that. Overview: Mobile app analytics metrics Below is a quick summary of the mobile metrics every PM should be tracking. The competition is stiff.
This is where metrics can be invaluable, giving clarity on performance, and circumventing potential issues. But with so much data to consider, how can you define the help desk metrics that matter for your team? What are help desk metrics? Help desk metrics vs. KPIs.
It’s no secret that learning how to evaluate product performance is essential for product management. But how can you effectively measure productmetrics that can help you reach your goals and increase revenue growth? Why not book a Userpilot demo to see how you can analyze and improve product performance continuously?
Poor performance includes slow loading times, complex design, confusing navigation, and unresponsive features. This article will help reduce such churn by refining your product management and UX analysis approach. How to start your UX analysis. Even though they’re the ones using the product.
This is where these 10 key mobile app engagement metrics come in, helping track user behavior and preferences to answer all these questions and boost user activation. What are app engagement metrics? App engagement metrics provide quantitative insights into user interactions with your app. What is app engagement?
What is an interactive product demo? An interactive demo is a self-guided walkthrough that uses tooltips, modals, hotspots, and other interactive elements to help users quickly explore your SaaS product. Why build interactive demos for your SaaS product? This results in faster Aha!
Tracking the right user metrics helps you precisely identify issues in the product experience rather than feeling lost in a sea of data. Choosing the wrong KPIs can be more damaging than you think – it drains your teams resources, shifts focus away from real problems, and ultimately, disrupts the customer experience.
Guest Post by: Merziyah Poonawala (Mentee, Session 9, The Product Mentor) [Paired with Mentor, Joni Hoadley]. A startup development team consisting of a product manager and two offshore engineers was facing major challenges in meeting client deliverable deadlines – repeatedly. THE CAUSE. THE EXPERIMENTS.
You see, although we work hard to make Userpilot the best product adoption tool on the market, we know it isnt the perfect fit for every business. Helping prospects find the right product is a win-win situation. Userpilots key features include: No-code Chrome extension for building in-app flows. Pendo The dashboard on Pendo.
Collect customer data to calculate complex formulas for tracking metrics, monitor customer health scores, and resolve support tickets while continuously trying to improve retention and expansion. Consider specific features : Your goals and improvement areas will determine the features you need.
When you’re building a mobile product , data is your lifeline. Whether for tracking feature adoption or spotting drop-off points, the right analytics tool can make or break your growth. Some tools are great for marketers, and others are for product or development teams. Here are a few that I think do that well. #1
A customer expansion strategy is a playbook for increasing the revenue from your existing customers, for example, by selling them additional products and services or encouraging them to upgrade to higher plans. This metric helps SaaS companies track the effectiveness of their expansion efforts. What metrics should you consider?
What is product experience? Product experience refers to the customer journey that takes place within the product itself, from a person’s first login to their last time using the application. It is a broader, more end-to-end view of user experience, which refers to specific interactions a person has within a product.
At Userpilot, NPS is an integral part of our product. This is mainly because NPS was sold as a quantitative metric that is the ultimate indicator of growthespecially in product management. This metric ended up being adopted by companies in every industry. But lets be honest, NPS sucks at times. The sad truth is: its not.
Userpilot’s SaaS ProductMetrics Benchmark Report has found that compared to other industries, healthcare SaaS companies perform lower across most of the 6 metrics we studied. You will also learn how healthcare companies can improve their productmetrics. Onboarding checklist completion rate. Time to Value.
Hello Product Talk readers, we’re excited to share the latest Product in Practice with you! For this story, we caught up with Sonja Martin , Product Manager at tails.com. As Hope Gurion discussed in a recent Product Talk post , product teams are often assigned business outcomes rather than product outcomes.
In SaaS, a new user activation dashboard can become a massive product analytics tool to understand and optimize the user journey. Let’s explore how a new user activation dashboard works, look at the key metrics you need to include in it, and see how it can help you unlock ways to retain more customers. What is user activation?
In SaaS, a customer onboarding dashboard can become a massive product analytics tool to understand and optimize the user journey. But what type of dashboards can you use to analyze your onboarding process? Let’s explore how a customer onboarding dashboard works and see different examples.
Think of Net Promoter Score (NPS) software as a tool to measure your customers’ feelings about your product, and categorize them based on their level of loyalty (promoters, neutrals, and detractors). The great advantage of these tools is that they streamline the creation, distribution, and analysis of NPS surveys.
” And that’s also why AARRR metrics are called pirate metrics. Short for acquisition, activation, retention, referral, and revenue, these metrics help you measure and drive product growth. In this article, we’ll dig deeper into the AARRR framework and the relevant metrics associated with each stage.
MarTech companies had the lowest onboarding c completion rates of all the industries we studied for our SaaS ProductMetrics Benchmark Report. Does it have any impact on new user activation, time-to-value, or other metrics? We also show you how you can improve the key success metrics for your MarTech SaaS.
That’s the average core feature activation rate across the companies we studied for our ProductMetrics Benchmark Report 2024. We also look at ways to improve the core feature activation rate for your SaaS product! We also look at ways to improve the core feature activation rate for your SaaS product!
Does the thought of quantitative data analysis bring back the horrors of math classes? But conducting quantitative data analysis doesn’t have to be hard with the right tools. Want to learn how to turn raw numbers into actionable insights on how to improve your product? Defining goals and KPIs. Visualizing the data.
Data analysis is integral to a product manager’s job – it’s what helps them build impactful products. This article dives deep into data analysis for product managers. This approach is vital in modern product management , and every product manager needs to embrace it.
An interactive user guide is a set of UI patterns designed to work together and help customers understand how to use your product. All product managers want to delight and engage their customers. But there’s more: Interactive user guides improve user onboarding and drive product adoption.
Whether you’re introducing a new product, releasing an upgrade, or announcing advanced features, outlining a product launch strategy can help align your efforts in the right direction. That’s where product launch analytics step into the picture. The key is to monitor all the data and optimize your strategy at each step.
Let’s be honest, onboarding in SaaS can feel like navigating a labyrinth. As product managers and onboarding specialists, you’re juggling a million priorities: feature adoption, activation milestones, reducing churn… And crafting the perfect email sequence that guides users to success? What are they?
Funnel analysis examples can help product managers find the missing puzzle pieces to improve user journeys. From marketing funnel analysis to review funnel analysis, this article shows you the most important funnels for SaaS. Funnel analysis allows you to: Measure company performance. Onboarding process funnel.
For today’s Product in Practice , we caught up with Kranthi Kiran , the Founder of ThoughtFlow. Do you have a Product in Practice success story you’d like to share? He says, “My earlier approach to building products was to start with an idea, build a product, and then market it.” It’s a vicious cycle.
Wondering how Aha moments lead to feature and product adoption? The articles explains what the Aha moment is and what role it plays in user activation, product adoption , and customer retention. You will also learn how to find the Aha moment for your product and optimize it for different users. Ready to dive in?
Performing trend and product analytics can help you make data-backed informed decisions to stay ahead of the competition. With trend analysis, you’ll be able to better understand both internal and external factors affecting your business operations.
Most product analytics tools make tracking user activity on web applications look easy, and it is. What matters is whether users complete meaningful actions, like onboarding, purchases, or content consumption. What you really want is to track behaviors tied to user needs, feature adoption , and conversion goals.
A product adoption dashboard helps you visualize key adoption metrics so you can make data-driven decisions and boost user engagement. In this article, we cover the following: Why you need a product adoption dashboard. The most important metrics to track and why they matter. Track product adoption metrics in one view.
Leveraging product analytics isnt just about making pretty dashboards; its about viewing your existing data as a learning opportunity to make informed decisions with your onboarding strategy. Start with your core business goals and map out 3-5 key metrics that directly support these objectives. How to solve this issue?
We organize all of the trending information in your field so you don't have to. Join 96,000+ users and stay up to date on the latest articles your peers are reading.
You know about us, now we want to get to know you!
Let's personalize your content
Let's get even more personalized
We recognize your account from another site in our network, please click 'Send Email' below to continue with verifying your account and setting a password.
Let's personalize your content