
Userpilot vs UserGuiding: Which is Better for User Analysis?
Userpilot
APRIL 14, 2024
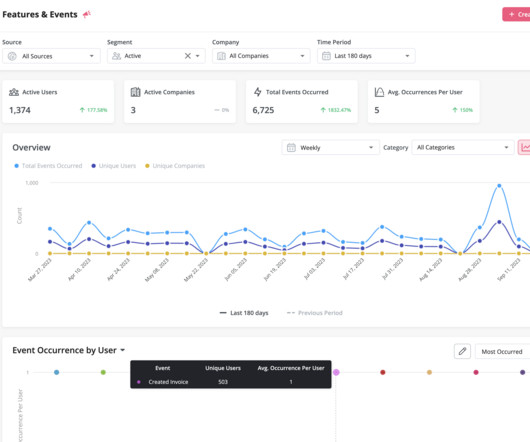
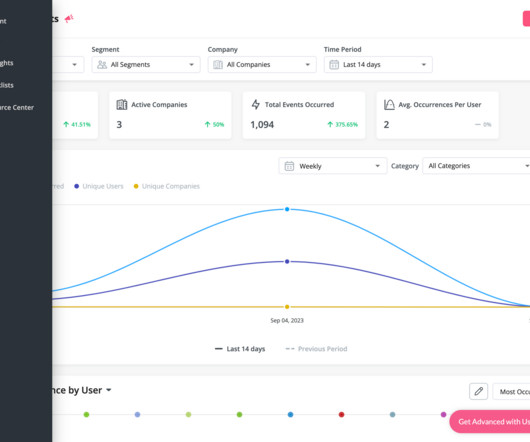
Analytics dashboards : These include no-code reports and dashboards that you can easily build to draw meaningful insights from collected data. It’s also highly recommended that these dashboards have advanced segmentation filters so you can filter data for a better understanding of specific user groups.


Let's personalize your content