This site uses cookies to improve your experience. To help us insure we adhere to various privacy regulations, please select your country/region of residence. If you do not select a country, we will assume you are from the United States. Select your Cookie Settings or view our Privacy Policy and Terms of Use.
Cookie Settings
Cookies and similar technologies are used on this website for proper function of the website, for tracking performance analytics and for marketing purposes. We and some of our third-party providers may use cookie data for various purposes. Please review the cookie settings below and choose your preference.
Used for the proper function of the website
Used for monitoring website traffic and interactions
Cookie Settings
Cookies and similar technologies are used on this website for proper function of the website, for tracking performance analytics and for marketing purposes. We and some of our third-party providers may use cookie data for various purposes. Please review the cookie settings below and choose your preference.
Strictly Necessary: Used for the proper function of the website
Performance/Analytics: Used for monitoring website traffic and interactions
72% of shoppers would stay loyal to brands they loved even if it meant paying more. But if you’re not measuring how your brand is performing, how can you build—or protect—that loyalty? That’s where brand health tracking comes in. What is brand health tracking? Think of it as your brand’s pulse check.
Surveys provide a range of insights, from quick feedback after a purchase to in-depth assessments of brand loyalty. They are also inclined to recommend the brand to others. To read more about this and how you can elevate your CX strategy in the future, download our Quick Guide to Transforming Your CX Strategy with Open Text Analysis!
The great advantage of these tools is that they streamline the creation, distribution, and analysis of NPS surveys. Plus, the ability to create custom NPS dashboards allow you to analyze the results easily without writing a line of code. Leverage AI-driven sentiment analysis to analyze and categorize open-ended responses quickly.
This article will help reduce such churn by refining your product management and UX analysis approach. How to start your UX analysis. UX analysis benefits product managers by providing data-driven insights to guide product development decisions and prioritize features. Quantitative data used to be enough for UX analysis.
But today, dashboards and visualizations have become table stakes. Think your customers will pay more for data visualizations in your application? Five years ago they may have. Discover which features will differentiate your application and maximize the ROI of your embedded analytics. Brought to you by Logi Analytics.
A customer sentiment dashboard is a great way to visualize customer feedback and see what users love (or hate) about your product. But how do you collect the right data for your analysis? Customer sentiment dashboards help you generate the following: Sentiment trends over time. Text response analysis.
Pain Point #4: Lack of customization Generic, one-size-fits-all feedback interfaces can damage brand consistency and reduce response rates. Your customers expect a seamless, branded experience across all touchpoints. With Alchemer, you can customize every touchpoint to match your brand identity.
As you’re researching dashboard reporting tools, you’ve probably noticed how hard it is to find reliable information on the available solutions. To make your life a little bit easier and help you choose the best dashboard analytics tool for your SaaS, we’ve produced a guide of 12 excellent platforms available on the market in 2024.
Reveal Embedded Analytics If you’ve ever struggled to create new dashboards with similar KPIs, integrations, and layouts but different data sources, this article is for you. What Are Dashboard Templates? Dashboard templates are pre-designed layouts that provide a framework for organizing and presenting data in a visual format.
In this article, we’ll explore some key metrics, analysis techniques, as well as actionable strategies to track and enhance your product performance. TL;DR Product performance analysis involves evaluating and measuring a product’s effectiveness, usage , and impact using various analytics tools.
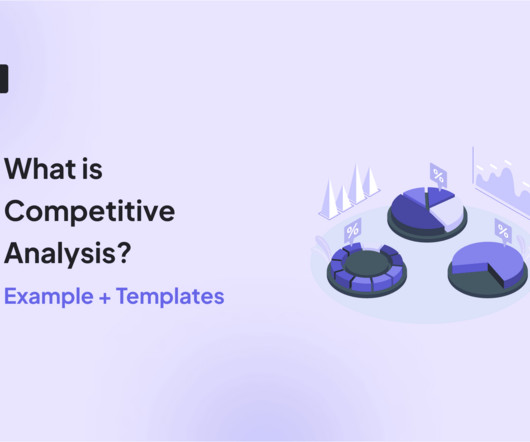
Carrying out a competitive analysis can give your product an edge that may disrupt your industry and impact your bottom line. This article will help you conduct your own by providing you with a competitive analysis example and some templates. If you need to collect customer feedback to aid your competitive analysis, consider Userpilot.
To get that insight, many product managers and marketers rely on funnel analysis to chart the different paths users take. Clarifying those differences will help you conduct your own funnel analysis and streamline users’ journey to conversion. What Is Funnel Analysis? B2B SaaS Funnel Analysis. Ecommerce Funnel Analysis.
Are you wondering how the new Userpilot custom analytics dashboards can help you drive product growth? In this article, you will learn about the main benefits of custom product analytics dashboards and how to create them in Userpilot. TL;DR Userpilot custom analytics dashboards allow you to display multiple reports in one place.
Brand monitoring is a crucial part of any product’s development process. What is brand monitoring? Brand monitoring is the tasks and activities you do that help you track and monitor what people say about your product and brand across multiple channels. How can brand monitoring help your business?
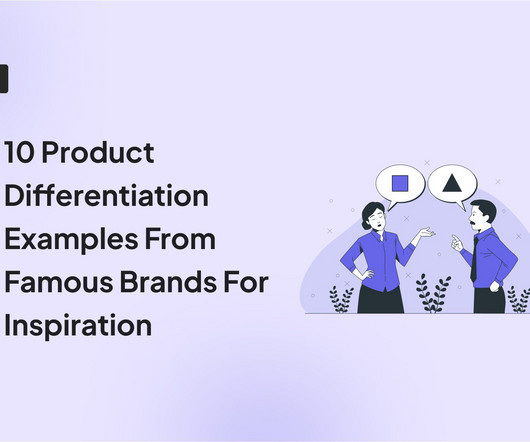
In this article, we’ll explore the types of product differentiation strategies and go over cases of real-world brands that have used these strategies to drive product growth. This process grants you a competitive advantage and fosters brand loyalty. Apple differentiates itself through brand image and reputation.
For example, say a user opens your app, skips the onboarding tutorial , and heads straight to the dashboard. You can also pair your session replay insights with heatmap analysis of the same screens. For example: Suppose users are dropping off before finishing their dashboard setup. What does that tell you?
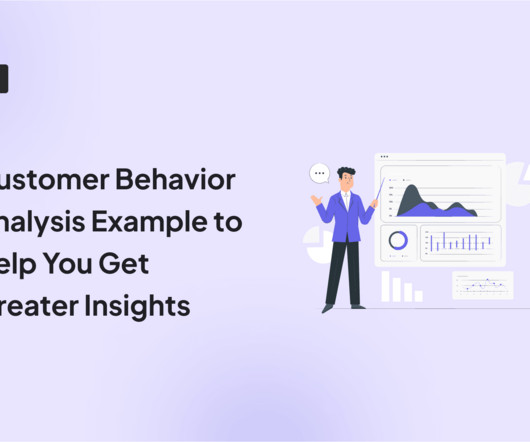
Looking for a customer behavior analysis example to see how you can extract valuable insights? In this article, you will also learn how to conduct customer behavior analysis step-by-step and how Userpilot analytics can help. To gain meaningful insights, the analysis should focus on specific user segments.
A product analytics dashboard helps you visualize user behavior, so you can make informed decisions on how to improve product engagement. In this article, we cover the following: Why you need an analytics dashboard. The types of metrics to track in your dashboard. The most common analytics dashboards in SaaS.
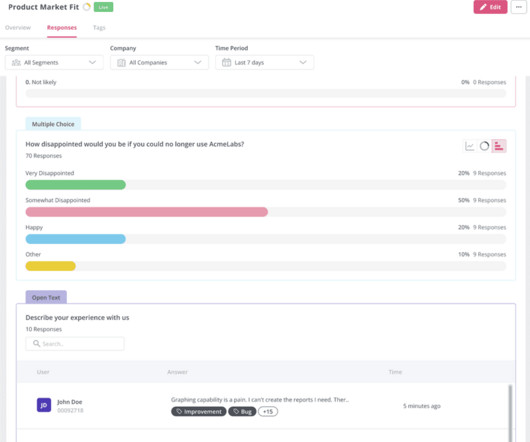
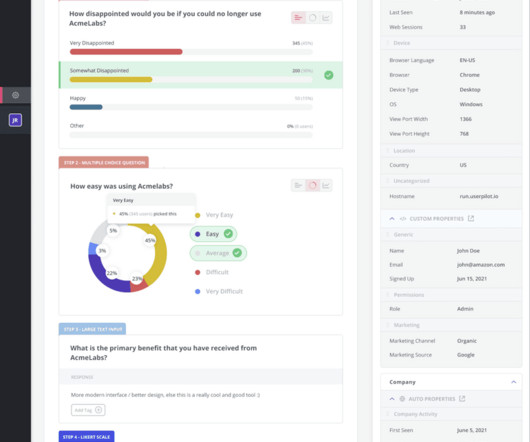
Wondering how an NPS dashboard can help you track customer loyalty? This is where the NPS dashboard comes in. Let’s see how the dashboard can help you extract insights from NPS responses and improve customer loyalty. Five key NPS visualizations are bar chart, pie chart, line chart, response tag analysis, and word cloud.
Your product needs to serve your customers, and a customer needs and wants analysis helps to ensure you are addressing all customer pain points. In this article, we’ll learn more about customer needs, conducting customer needs analysis, and how to gain insights from it with a tool. Book a demo to learn more!
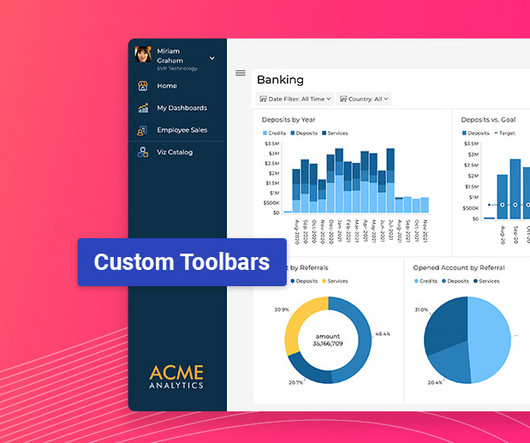
Latest Update Features: Custom Toolbars: Full control over dashboard menus. Custom Toolbar Options: Full Control Over Menus Developers can now fully customize dashboard and visualization toolbars using the revealView.onMenuOpening event handler. Date-based filtering allows single-date selection for precise analysis.
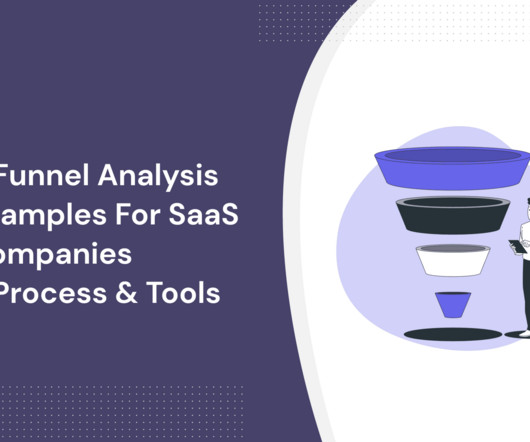
Funnel analysis examples can help product managers find the missing puzzle pieces to improve user journeys. From marketing funnel analysis to review funnel analysis, this article shows you the most important funnels for SaaS. Funnel analysis allows you to: Measure company performance. Create data-driven product roadmaps.
mParticle is the customer data platform for brands leading the CX revolution. Our SDK is instrumented into mParticle, and when a mParticle customer decides to leverage Apptentive, a switch is flipped on in their dashboard which gives them immediate access to Apptentive. Mobile in-app feedback tools & solutions. Apptentive.
Next, conduct a path analysis to identify the ideal path for each persona. This means using the welcome survey discussed above to learn what users expect from your brand. Gamification involves integrating game mechanics like challenges, rewards, and feedback to boost enthusiasm for your brand. – to gamify their onboarding.
Apptimize can help brands create powerful audience segments, identify the cause of conversion funnel drop-offs, and test new features. Apptentive’s Apptimize Integration enables the use of Apptentive Surveys, Notes, and the Love Dialog as a follow up to Apptimize experiments for deeper understanding and qualitative analysis.
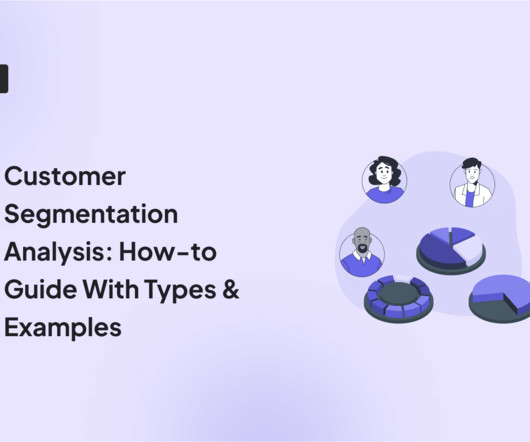
Customer segmentation analysis allows you to break down your users into distinct groups and gain valuable insights into them. In this article, you’ll learn about various types of customer segments you can identify and how to conduct a thorough analysis using the right product analytics tools. . Take action based on the analysis.
mParticle is the customer data platform for brands leading the CX revolution. Our SDK is instrumented into mParticle, and when a mParticle customer decides to leverage Apptentive, a switch is flipped on in their dashboard which gives them immediate access to Apptentive. Mobile in-app feedback tools & solutions. Apptentive.
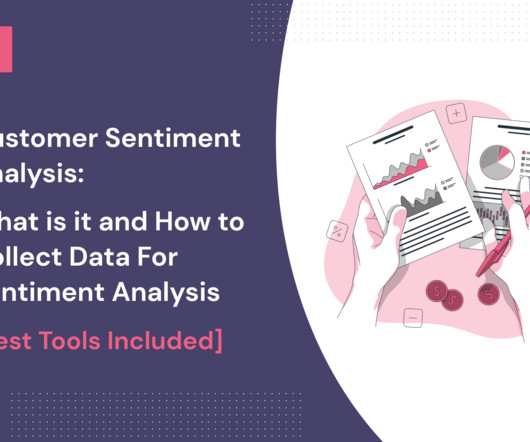
Wondering how customer sentiment analysis can improve your product’s customer experience and generate more profits? Today’s businesses use numerous sentiment analysis tools to figure out the different emotions that customers go through while exploring your products and services. What is customer sentiment analysis?
Harnessing the power of data-driven analysis can transform how you make decisions , fine-tune your strategies, and, ultimately, boost your bottom line. This article will be your go-to guide, breaking down the concept of data-driven analysis and showing you practical ways to apply it to your specific business needs. Sentiment analysis.
E.g., Identify navigation issues in your analytics dashboard based on real-time user interactions. To keep the data manageable, you also need to have a system of data organization in place, such as transcriptions, spreadsheets, qualitative analysis tools, etc. Both data types require different analysis methods.
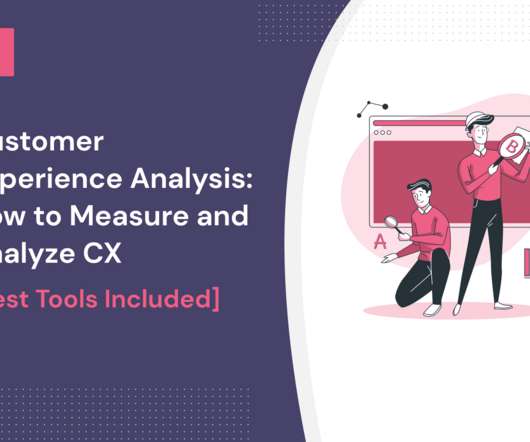
Wondering how to collect CX data and conduct a customer experience analysis effectively to boost your product growth ? In this article, you’ll learn what customer experience analysis is, why it’s important, how to measure and analyze it using metrics, and how to collect customer data for it. Let’s go!
Acquisition: Discovery and Attraction of IdealUsers In the acquisition phase, the goal is not simply to attract as many users as possible but to identify and engage those most likely to become loyal customers and brand advocates. b) Friction Point Mapping: Analysis of activation funnels to identify stages with high abandonment rates.
Wondering how to unlock the full potential of your survey data and if survey data analysis will be of any help? The sheer volume of data generated can quickly become overwhelming, and this is where survey data analysis can help you. Quantitative data is numerical data or information you can easily measure for analysis.
One look at your mobile app analytics dashboard, and you just want to shut your eyes and scream in frustration. This is harder than it seems and takes skill in analysis. Update dashboards and alerts: I edit my custom dashboards to reflect the new metrics, so I can monitor them at a glance. I archive ones that dont.
We had just signed up a travel brand that requires us to do something entirely different from what we’ve experienced with some of our real estate brand. I did a bit of research on the cost-benefit of having a centralised dashboard to manage client’s ads with the selected channels and running multiple channels for individual clients.
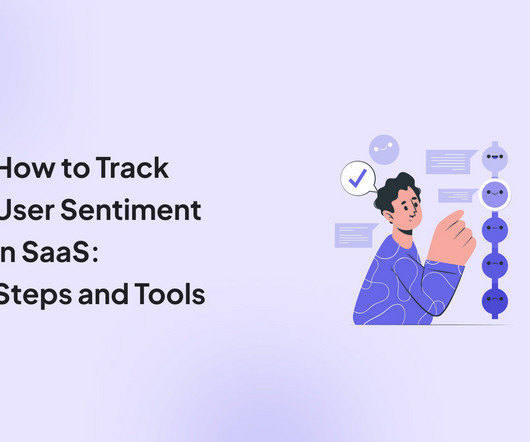
In this article, we’ll explain what user sentiment analysis is, why it’s important, and uncover some of the best tools for tracking and analyzing customer sentiment. TL;DR User sentiment is the feeling a person has about your brand, product, or service quality. Brand24 – best for brand sentiment analysis.
Social listening tools : Software for monitoring online conversations, brand mentions, and trends. Sentiment analysis tools : Software that analyzes customer feedback, reviews, and social media mentions to determine public sentiment (positive, negative, or neutral). Free trial?
Heres an example of how I would use Userpilot paths and funnel analysis to see and understand how users navigate an app: I would list the core events (like install, first search, cart add, and checkout), then specify them in Userpilots Paths. Userpilot paths and funnel analysis to see and understand how users navigate an app.
Create custom analytics dashboards to track your key metrics over time. First-party data is valuable because it is specific to your company’s customers and prospects, providing insights into their behavior, preferences , and engagement with the brand. This will give you insights into brand sentiments and customer feedback.
Monitor and analyze customer activity on social platforms to gain unsolicited feedback and understand brand perception. Userpilot allows you to gather customer insights through in-app surveys and behavior analysis. Attitudinal insights : Insights into customer attitudes and perceptions that shape their view of your brand or product.
It provides features such as (custom) event tracking , customer segmentation, and multiple analytical reports, for example, funnel and cart analysis. Catering to businesses of all sizes, it enables teams to track user interactions with the brand at different stages of the customer journey. Conversion driver analysis.
These surveys often blend structured data with deeper segmentation and statistical analysis. They’re especially useful in product development, brand positioning, or when entering a new market. Advanced tools also allow for automation, logic branching, integrations, and role-based access for collaboration across teams.
A good product analytics tool should offer varied features for measuring customer behavior, integration options, data visualization dashboards, and automatic data capture. Zoho Analytics is a business intelligence and analytics platform offering many features to meet diverse data analysis requirements.
Reveal Embedded Analytics Today’s business users expect more than static dashboards or delayed reports. Here is what best-in-class embedded self-service BI should deliver: Simple Dashboard Creation : Drag-and-drop editors your users actually want to use. You are not simply looking for drag-and-drop dashboards.
We organize all of the trending information in your field so you don't have to. Join 96,000+ users and stay up to date on the latest articles your peers are reading.
You know about us, now we want to get to know you!
Let's personalize your content
Let's get even more personalized
We recognize your account from another site in our network, please click 'Send Email' below to continue with verifying your account and setting a password.


Let's personalize your content