This site uses cookies to improve your experience. To help us insure we adhere to various privacy regulations, please select your country/region of residence. If you do not select a country, we will assume you are from the United States. Select your Cookie Settings or view our Privacy Policy and Terms of Use.
Cookie Settings
Cookies and similar technologies are used on this website for proper function of the website, for tracking performance analytics and for marketing purposes. We and some of our third-party providers may use cookie data for various purposes. Please review the cookie settings below and choose your preference.
Used for the proper function of the website
Used for monitoring website traffic and interactions
Cookie Settings
Cookies and similar technologies are used on this website for proper function of the website, for tracking performance analytics and for marketing purposes. We and some of our third-party providers may use cookie data for various purposes. Please review the cookie settings below and choose your preference.
Strictly Necessary: Used for the proper function of the website
Performance/Analytics: Used for monitoring website traffic and interactions
Introduction to customersatisfaction surveys Customersatisfaction surveys are vital tools for understanding what customers think, feel, and experience. This information empowers teams across your company to make informed decisions based on customer experiences and perceptions.
According to the American CustomerSatisfaction Index , with an ACSI score of 78.0, overall customersatisfaction in America was the highest it has ever been in Q1 2024. However, while some companies have managed to improve their customersatisfaction levels and benefit from it, many have not.
Financial Analysis Nishant described financial analysis as one of the more challenging product management activities, with significant variations between different organizational contexts. This activity encompasses business case development, pricing strategies, and ongoing financial validation.
Aarti : AI simplifies tasks like summarization and analysis, but human judgment remains essential for accuracy and context. Aarti : Showcase measurable results like improved customersatisfaction and achieved business goals. Q: How has the IC PM role evolved with AI tools?
Modern approaches include: Advanced Research Technologies Eye tracking for user experience studies AI-powered customer insight analysis Predictive analytics for market trends Sensory analysis techniques 6. The project, named “Sicily Left,” aimed to create a mouse specifically for left-handed users.
Basically, anything that ruins the user experience. This article will help reduce such churn by refining your product management and UX analysis approach. How to start your UX analysis. UX analytics involves gathering, analyzing, and interpreting data about how users interact with your product or service.
The collaboration between AMS and MIT researchers has yielded impressive results, with AI tools not only matching human analysts in identifying customer needs but often exceeding themespecially for emotional needs that humans might overlook. In this discussion, we’ll explore how LLMs are revolutionizing Voice of the Customeranalysis.
Surveys, combined with open text analysis, however, hold immense potential for uncovering deeper customer insights from customer feedback. In this post we explore how to effectively incorporate open text analysis into your CX survey strategy to unlock those deeper customer insights.
While Kim didn’t directly own a P&L, her compensation structure became tied to business outcomes such as profitability, product growth, and customersatisfaction metrics. The VP role also brought new financial responsibilities and accountability.
Think of Net Promoter Score (NPS) software as a tool to measure your customers’ feelings about your product, and categorize them based on their level of loyalty (promoters, neutrals, and detractors). The great advantage of these tools is that they streamline the creation, distribution, and analysis of NPS surveys.
Thats why you need user session analysis. By combining contextual insights from session replays , heatmaps, and behavior analytics, user session analysis helps you interpret metrics through the lens of real user journeys. Quantitative data alone doesn’t reveal intent, only outcomes.
When it comes to A/B testing , AI-driven tools can automate the comparison of multiple design versions, gathering data to show which options resonate best with users. This automation streamlines decision-making and ensures designs are optimized based on actual user responses. Finally, we have user research analysis.
Because every touchpoint is a chance to enhance the user journey and maximize conversionssomething we delve into deeply in our Funnel Analysis atBlikket. Its about creating a seamless and intuitive experience that reduces friction and keeps users moving forward. But why focus on UX design at each stage of this funnel?
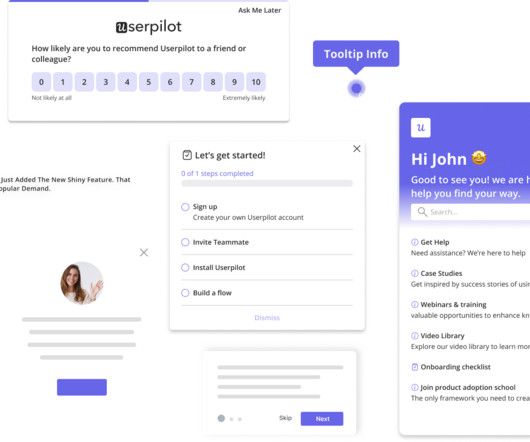
In-app guides are part of a self-serve onboarding strategy; they reduce support and customer success costs while increasing customersatisfaction. Users get access to help just when they need it. Mobile support: Create interactive user guides for Android and iOS mobile apps. What are their key features?
Engaging in a well-structured product discovery process enables teams to move beyond assumptions and build solutions that drive true usersatisfaction. Conducting user research , including surveys and interviews, is essential for understanding target users and refining product features.
A higher stickiness ratio suggests your product is a regular part of users routines. However, a low stickiness ratio may signal issues with usersatisfaction, feature relevance, or overall value, prompting further investigation. User stickiness formula. Customersatisfaction score (CSAT) formula.
Feature adoption (users who use more advanced features). Customersatisfaction score and customer loyalty (NPS). With Userpilot, you can segment users based on multiple criteria, including: Demographics, like age, language, or location. For example, users might feel anxious about signing up for a paid plan.
For example, in a recent Lenny’s Podcast , Archie Adams shared that Shopify runs experiments with cohort analysis after 1, 2, 3, 4, and 5 years as the CEO’s vision is to build “the right things for commerce 100 years from now” Looking for specifics? The metrics are similar yet the analysis is over an extended period.
Not knowing their advantages and relationships, places you at a severe disadvantage with a crucial lack of visibility and end-usersatisfaction. By incorporating analytics directly into your product, you provide users with tools that not only address their pain points but also generate richer data for analysis.
Voice of customer tools : Platforms that capture and analyze customer feedback across channels to help you understand how customers feel and talk about your product. 21 product feedback tools for feedback collection and analysis We’ve analyzed the 21 best product feedback tools in the market. Free trial?
Gamified welcome screens A great example is using gamified welcome screens to capture users’ attention and guide them through essential actions. Attention Insight — an AI tool for heatmap analysis — encountered a roadblock with user activation during its free trial, where only 47% of users completed a heat map analysis.
As companies mature, so does their understanding of how strategic research drives product innovation and customersatisfaction. Meanwhile, for enterprises with deeper pockets, investing over $500K annually in user research has become a competitive advantage particularly in fast-moving industries like fintech, SaaS, or e-commerce.
Analytics reports like paths, funnels, and cohort tables for visualizing user behavior data. Session replays to see how users navigate your product. 15+ survey templates (NPS, CES, usersatisfaction surveys, etc.) for collecting user sentiment data. NPS response tagging for analyzing qualitative feedback.
It only measures promoters, which are loyal customers that are so infatuated with your product that they cant help but talk about it. However, so many companies use it to measure satisfaction. If 100% of your user base is satisfied with your product but only hits a score of 8. Path analysis. Then your NPS would be zero.
Product managers should include market analysis, customer insights, risk assessments, and anticipated ROI to reinforce the product’s strategic value. By focusing on small details that can surprise and delight users, designers can increase customersatisfaction and loyalty, which is essential in competitive markets.
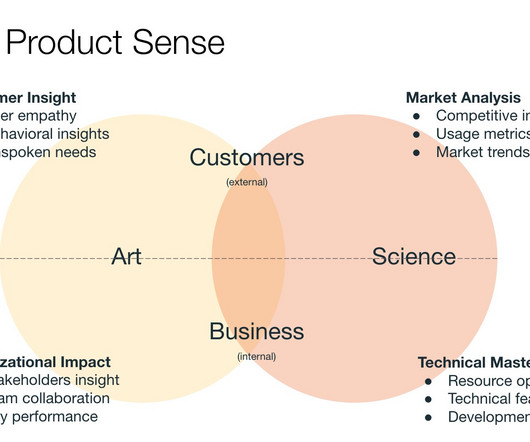
This guide breaks down the essentials: Customer Insight, Market Analysis, Organizational Impact, and Technical Mastery. Conduct training sessions exploring case studies of companies that successfully made this transition, highlighting the benefits in growth, usersatisfaction, and business outcomes. Lean into your triads.
Make data-driven decisions that align with business goals You can use real user monitoring to adopt a data-driven analysis approach because it turns abstract user behavior into measurable metrics. With this data, you can create a comprehensive view of how your users are interacting with your product.
In a creative writing assistant project, we deliberately embraced variability by adding controls that let users adjust the degree of surprise in generated suggestions. Users could choose between more predictable, consistent outputs or opt for bold, diverseideas.
Without intuitive, embedded self-service capabilities, organizations experience bottlenecks that impede scaling analytics and limit user empowerment. They affect product adoption, customersatisfaction, and an organization’s ability to operate with agility. These limitations extend beyond technical inconvenience.
Monetization potential: If users spend significant time within your app but dont convert, that might indicate that your pricing or checkout flows need rethinking. Measure usersatisfaction : Metrics like session length and frequency of use evaluate if users are happy with the app experience.
b) A/B Testing on Landing Pages: Systematic testing combined with quick interviews with non-converting users helps refine the value proposition before significant investments in paid media. Case Study: VirginAmerica Virgin America undertook a complete website redesign in 2014, grounded in extensive user research.
1 Engagement DAU/MAU Understand daily and monthly active user engagement and overall app popularity. 2 Engagement Feature adoption Gauge user interest in new features and optimize feature development. 3 Engagement Average user session length Measure user interactions and identify areas for improved content or flow.
Understanding your main objective helps tailor the approach to user behavior analysis. Increasing new user activation Boosting feature adoption Improving trial-to-paid conversion How do you currently analyze in-app user behavior? You can identify such customers by their low engagement and NPS scores.
Flow automation : Simplify repetitive support processes by automating tasks like ticket routing and prioritization or collecting customer data. This frees up time for customer success managers to focus on more strategic tasks. Main features : AI-based features, like call sentiment analysis. Integrated customer data.
Scalability: Ensure the platform can handle increasing data volume and user activity without slowing down. Artificial intelligence (AI) capabilities: Like predictive modeling or sentiment analysis, can help you uncover hidden patterns in your customer data. Analyze user funnels in Userpilot.
The long answer: once you know what your customers want, you reduce the risk of product failure. Instead, you can build products with a better product-market fit that address all user demands and improve customersatisfaction. For example, 71% of customers now expect far more personalization than before.
Conversion funnel tracking : Analyzes where users abandon processes like the onboarding flow. Click & Scroll heatmaps: Displays areas where users click, scroll, and engage the most. User journey analysis : Tracks the flow of users across pages to detect drop-offs. Example of New Relics dashboard.
Your work will help increase activation and engagement, expand our market opportunity through self-serve capabilities, and deliver meaningful customer and business impact in one of HubSpots most strategically important areas. Someone passionate about user-centered design and creating solutions that drive value and customersatisfaction.
Advanced tagging, and annotation features tailored for qualitative research: Dovetail stands out with its automatic tagging, sentiment analysis, and annotation capabilities, designed for qualitative data like interviews or surveys. These tools simplify data organisation for teams handling diverse datasets.
Set clear goals before getting into the analysis Analytics backwards looks like this: track first with mobile app analytics tools, find patterns later. Analytics forwards starts with understanding user psychology. You see, users don’t follow the linear paths designed for them. For instance, why did the user leave?
For Customer Success leaders, the pressure to drive not just retention but also revenue growth is intensifying. Customer Success teams are no longer simply the keepers of customersatisfaction; they are rapidly evolving into critical drivers of expansion and revenue outcomes.
Limited quantitative analysis capabilities: Hotjars data visualizations are limited to heatmaps and funnel analysis reports. It lacks other analytics reports such as cohort retention reports, path analysis, and custom dashboards. Cohort retention analysis in Userpilot. Session replays in Userpilot.
Heres an example of how I would use Userpilot paths and funnel analysis to see and understand how users navigate an app: I would list the core events (like install, first search, cart add, and checkout), then specify them in Userpilots Paths. Userpilot paths and funnel analysis to see and understand how users navigate an app.
The next step is to go deeper into the key strategies that impact engagement, retention, and usersatisfaction. Top 5 strategies for mobile app optimization 53% of users abandon an app if it takes more than three seconds to load. Screen View Tracking helps pinpoint which screens drive engagement and where users drop off.
We organize all of the trending information in your field so you don't have to. Join 96,000+ users and stay up to date on the latest articles your peers are reading.
You know about us, now we want to get to know you!
Let's personalize your content
Let's get even more personalized
We recognize your account from another site in our network, please click 'Send Email' below to continue with verifying your account and setting a password.


Let's personalize your content