This site uses cookies to improve your experience. To help us insure we adhere to various privacy regulations, please select your country/region of residence. If you do not select a country, we will assume you are from the United States. Select your Cookie Settings or view our Privacy Policy and Terms of Use.
Cookie Settings
Cookies and similar technologies are used on this website for proper function of the website, for tracking performance analytics and for marketing purposes. We and some of our third-party providers may use cookie data for various purposes. Please review the cookie settings below and choose your preference.
Used for the proper function of the website
Used for monitoring website traffic and interactions
Cookie Settings
Cookies and similar technologies are used on this website for proper function of the website, for tracking performance analytics and for marketing purposes. We and some of our third-party providers may use cookie data for various purposes. Please review the cookie settings below and choose your preference.
Strictly Necessary: Used for the proper function of the website
Performance/Analytics: Used for monitoring website traffic and interactions
Without effective UX analytics that goes beyond collecting data, you’re losing valuable customers. Unfortunately, the research backs this up, with a staggering 90% of users reporting that they stopped using an app due to poor performance. It covers key topics, such as: Defining UX analytics. What is UX analytics?
While “use data to drive decision-making” sounds obvious, there’s a HUGE gap between saying it and doing it well. So, how do you get started with product analytics ? In this article, we’ll talk about: What product analytics is and why you need a solid strategy. What is product analytics?
You can gather all the user feedback or behavioral data you want or even generate tons of Google Analyticsreports. Despite all these efforts, you’re probably still not acting on product analytics correctly. Why actionable product analytics are important. This causes siloed data and integration issues.
When your company adopts multiple SaaS solutions to drive productivity, you unknowingly create a perfect storm for data fragmentation. Your customer information lives in Salesforce, while your support tickets are in Zendesk, your product usage data in Mixpanel, and your marketing campaigns in HubSpot. Sound familiar?
Speaker: Jim O'Leary, VP of Product Management, and Brian Elmi, Director of Product Management, NTENT
Most product dashboard review lagging indicators rather than leading indicator and focus on the wrong metrics to move the business forward. Join Jim O'Leary and Brian Elmi of NTENT as they share exactly what they've done to build successful dashboards. How to democratize data so that all teams in an organization can benefit from it.
Let’s review everything your customer success team has to do in the absence of any customer success tools. Collect customer data to calculate complex formulas for tracking metrics, monitor customer health scores, and resolve support tickets while continuously trying to improve retention and expansion.
Introduction to customer satisfaction surveys Customer satisfaction surveys are vital tools for understanding what customers think, feel, and experience. Surveys provide a range of insights, from quick feedback after a purchase to in-depth assessments of brand loyalty. Don’t worry, we’ve got you.
Most product teams get mobile app analytics wrong. They track 47 different key performance indicators (KPIs) in their mobile analytics platform , spend hours debating dashboard numbers, yet can’t predict which users will churn next week The problem here isn’t a lack of data.
Data can be a powerful tool if you know how to put it to work! Often I start my analytics conference keynote addresses by asking the audience to share the issues they face in their organizations. In fact, this issue is so pervasive in organizations that 80 to 90% of the analysts in the audience report this problem.
Speaker: Laura Klein, Principal at Users Know and Author of UX for Lean Startups
That's why Laura Klein, product manager and UX designer, has a set of tips to help application teams improve their embedded dashboards and reports. You'll learn: How to develop products that boost your business's bottom line while dramatically improving customer experience.
You know your product collects tons of data. Datavisualizationtools help turn your messy spreadsheets into clear, interactive insights. The best ones dont even need SQL or data science skills. Because product analytics should be easy and accessible for everyone, not just data experts.
It’s what you do with the behavior data your app collects. And by behavior data, I dont mean installs (thats the easy part). I mean what happens after the download: how users navigate, what features they engage with, and where they drop off. How to track it? What separates a good app from a great one?
Reveal Embedded Analytics For product owners, leveraging data is not just an advantageits a necessity. Product analytics empowers you to understand gaps in your offering and how users engage with your product. Both embedded analytics and product analytics are designed to help product owners in diverse ways.
In this article, you will explore why customer expansion matters for your SaaS growth, discover various customer expansion tactics, and learn how to embed them in successful expansion campaigns. How to calculate customer expansion revenue? What is a customer expansion strategy? These are available at the checkout at discounted prices.
Every data-driven project calls for a review of your data architecture—and that includes embedded analytics. Before you add new dashboards and reports to your application, you need to evaluate your data architecture with analytics in mind.
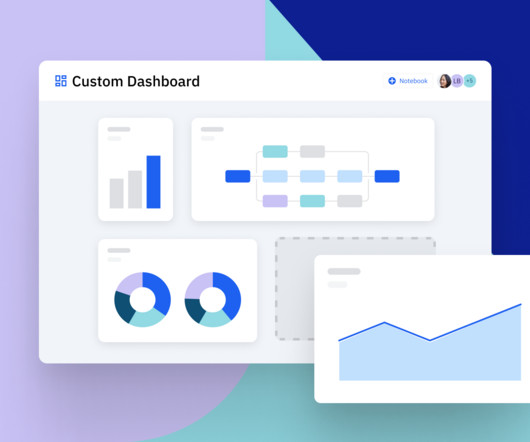
Are you wondering how the new Userpilot custom analyticsdashboards can help you drive product growth? In this article, you will learn about the main benefits of custom product analyticsdashboards and how to create them in Userpilot. Userpilot is a robust analyticstool so you can use its own data.
Heres how to take insights from customer feedback and turn them into results. Build a foundation that drives action Use reportingtools to translate feedback into trends. Turn survey responses, review data, and post-purchase feedback into clear dashboards your teams can actually use. Level it up!
How to Get Started: Audit the Product Backlog: Pinpoint low-effort, high-value opportunities to drive quick results. Pro Tip: Pair your quick wins with data. A dashboard showing metrics like feature adoption or user engagement amplifies your credibility. It shows youre thoughtful, analytical, and focused on results.
Case Study: Improving Data-Driven Decision Making for CSR Leadership Civian is a data-driven platform designed to help businesses measure, optimize, and showcase the social and economic impact of their investments in communities. Feature Engagement Users most frequently gravitated toward the map to explore and compare data.
Embedding dashboards, reports and analytics in your application presents unique opportunities and poses unique challenges. We interviewed 16 experts across business intelligence, UI/UX, security and more to find out what it takes to build an application with analytics at its core.
Visualdata surrounds us – colorful charts on weather reports, infographics on the web and in social media articles, map charts in presentations, etc. To help you get started with datavisualization, this article explores various visualization methods and their use cases. Funnel charts. Pie charts.
Wondering how to build a customer success dashboard for your team? From the article, you will learn what a customer success dashboard is, why you need it, and what metrics it should include. And how to build a dashboard for your customer success team using Userpilot analytics ! Let’s dive right in!
Quantitative data alone doesn’t reveal intent, only outcomes. By combining contextual insights from session replays , heatmaps, and behavior analytics, user session analysis helps you interpret metrics through the lens of real user journeys. Tools can track every click and interaction.
Would you like to learn how to design a SaaS metrics dashboard for your team without any coding? In the article, you will find examples of various SaaS dashboards and learn how to create them with Userpilot analytics. We also explain what metrics you may want to track and how to use the insights they offer.
Early stage startups in particular may not need a four year business plan, but they need to start building out a model which will show how they can someday be profitable. You'll learn: How to turn basic dashboard metrics into a financial model. Learn how margin of error impacts financial projections.
Tracking user behavior analytics in mobile apps is a whole different challenge compared to the web. Without a global DOM or easy auto-capture tools, tracking mobile app user behavior takes more planning. And the behavioral data you do collect depends on what you choose to track and how you track it. Mobile analytics ?
Example: Imagine you’re designing a new dashboard for a fintech app. This is where you’ll use the classic “How might we…” question to frame the problem. Example: For our dashboard, we might ask, “How might we create a dashboard that helps analysts quickly spot trends and take action?”
However, without qualitative feedback and behavioral insights, teams risk misreading signals, leading to frustration and churn. User feedback is valuable , but without data, its just opinions. To eliminate these blind spots, you need to combine quantitative, qualitative, and visualdata. How to collect each data type.
I’m going to take a wild guess and assume that you already understand the importance of mobile in-app feedback tools. You also might be reading this post thinking: “Who’s adding new tools to their tech stack right now?” Do you have the right tools to capture that voice? Mobile in-app feedback tools & solutions.
Dashboard design can mean the difference between users excitedly embracing your product or ignoring it altogether. Great dashboards lead to richer user experiences and significant return on investment (ROI), while poorly designed dashboards distract users, suppress adoption, and can even tarnish your project or brand.
If you are a SaaS company, the chances are you’ve come across the term “self-serve analytics” at some point online. Unlike traditional data analysis methods, self-serve analytics equips everyone in your organization to explore data and take the right actions in real time. Choosing a good business intelligence tool.
In a fast-paced industry like SaaS, leveraging business analytics effectively can be the key to staying competitive and driving product growth. Business analytics offers invaluable insights that help SaaS companies optimize operations, enhance customer experiences, and make data-driven decisions.
In 2006, British mathematician Clive Humby made the infamous statement: Data is the new oil. Like oil, raw data needs to be refined, processed and turned into something useful because its value lies in its potential. Unfortunately, most people have yet to understand what it truly means to use data. How to solve this issue?
Analyticstools offer a competitive advantage for companies investing in prolonged product growth. However, not all companies can invest precious resources in an analyticstool. In reality, some companies are better served using free vs paid analytics platforms. There are different types of analyticstools.
Speaker: Daniel O'Sullivan, Product Designer, nCino and Jeff Hudock, Senior Product Manager, nCino
We’ve all seen the increasing industry trend of artificial intelligence and big dataanalytics. In a world of information overload, it's more important than ever to have a dashboard that provides data that's not only interesting but actually relevant and timely. Dashboard design do’s and don’ts.
What happens when you build a product or service around what you think potential customers want, only for them to buy something else? It could include conducting user interviews and surveys, analyzing product usage data, and tracking customer feedback , to name a few. For starters, it shows you dont know your customers well enough.
A self-servicedata platform is the backbone of informed decision-making and a growing SaaS business. But how do you choose the right data platform for product analytics ? Let’s go over what a data platform is, its importance, and the must-have features you should consider to choose the right platform for you.
Thats where real user monitoring tools come inthey provide real-time insights into how users engage with the app , helping you detect performance issues before they impact your bottom line. But with so many options out there, how do you know which one to pick? Autocapture events dashboard in Userpilot.
Build your first analyticsdashboard by following our step-by-step guide that explains what makes an effective analyticsdashboard and how to implement it.
Speaker: Miles Robinson, Agile and Management Consultant, Motivational Speaker
So you want to set your product apart with the latest analytics, but you’re not sure where to start. How do you know what your customers want? And how can you make sure that you’re solving their problems? You’ll leave with a better understanding of where to begin on creating actionable, insightfuldashboards.
Explore the secrets of creating a successful Crypto Prediction and Opinion Platform, and provide users with insights to help them navigate the cryptocurrency market wisely. Crypto prediction platforms provide valuable insights into the volatile world of cryptocurrency markets, aiding users in making informed decisions.
With Userpilots mobile solution , you can personalize in-app flows, trigger context-aware push notifications, and capture real-time insights: all without writing a single line of code. To show you how, Ill cover seven strategies that smooth out friction, enhance user engagement, and turn one-off app downloads into returning customers.
In this article, Ill tell you how to: Increase user acquisition with ASO and referral programs. How to attract new users to your app Most product teams obsess over activation. Here’s how to build that system: 1. Its about building a repeatable system that drives discovery, boosts engagement, and keeps users coming back.
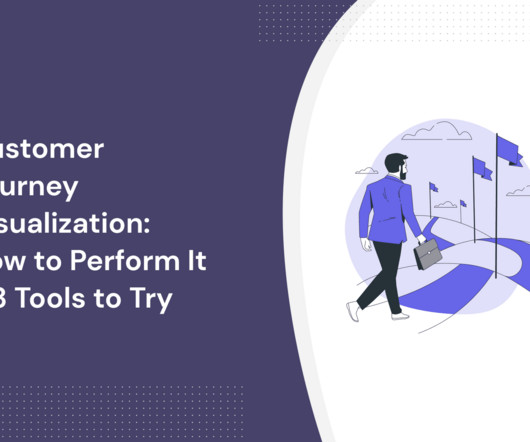
Want to conduct customer journey visualization but not sure what’s the best way to do it? This article shows you a step-by-step process for collecting customer data and creating easy-to-understand visual maps. Understanding these steps and the motivations behind them enables you to support customers in succeeding with your tool.
Speaker: Miles Robinson, Agile and Management Consultant, Motivational Speaker
Dashboards and analytics can really set your application apart, but that doesn't mean you can implement them and forget about them. Join Miles Robinson, former UX and Design Manager, as he explains the different ways to refresh your dashboards - and how to determine what's the best path to product dashboard success.
We organize all of the trending information in your field so you don't have to. Join 96,000+ users and stay up to date on the latest articles your peers are reading.
You know about us, now we want to get to know you!
Let's personalize your content
Let's get even more personalized
We recognize your account from another site in our network, please click 'Send Email' below to continue with verifying your account and setting a password.


Let's personalize your content