This site uses cookies to improve your experience. To help us insure we adhere to various privacy regulations, please select your country/region of residence. If you do not select a country, we will assume you are from the United States. Select your Cookie Settings or view our Privacy Policy and Terms of Use.
Cookie Settings
Cookies and similar technologies are used on this website for proper function of the website, for tracking performance analytics and for marketing purposes. We and some of our third-party providers may use cookie data for various purposes. Please review the cookie settings below and choose your preference.
Used for the proper function of the website
Used for monitoring website traffic and interactions
Cookie Settings
Cookies and similar technologies are used on this website for proper function of the website, for tracking performance analytics and for marketing purposes. We and some of our third-party providers may use cookie data for various purposes. Please review the cookie settings below and choose your preference.
Strictly Necessary: Used for the proper function of the website
Performance/Analytics: Used for monitoring website traffic and interactions
Without effective UX analytics that goes beyond collecting data, you’re losing valuable customers. Unfortunately, the research backs this up, with a staggering 90% of users reporting that they stopped using an app due to poor performance. It covers key topics, such as: Defining UX analytics. What is UX analytics?
How to plan a dashboard people will use: 10 Key Steps Dashboard user interface elements in light and dark modes Our team has built dashboards for a wide range of businesses, and we’ve picked up a few key insights along the way. A truly functional dashboard is always the result of collaboration.
While “use data to drive decision-making” sounds obvious, there’s a HUGE gap between saying it and doing it well. So, how do you get started with product analytics ? In this article, we’ll talk about: What product analytics is and why you need a solid strategy. What is product analytics?
The insights were buried in dashboards. And the noise around each new BI tool? In theory, leaders had access to more data than ever. In practice, they were still stuck waiting — for someone to pull the numbers, check the logic, and send the report. Insight delivered late is just expensive hindsight.
When your company adopts multiple SaaS solutions to drive productivity, you unknowingly create a perfect storm for data fragmentation. Your customer information lives in Salesforce, while your support tickets are in Zendesk, your product usage data in Mixpanel, and your marketing campaigns in HubSpot. Sound familiar?
Let’s review everything your customer success team has to do in the absence of any customer success tools. Collect customer data to calculate complex formulas for tracking metrics, monitor customer health scores, and resolve support tickets while continuously trying to improve retention and expansion.
Introduction to customer satisfaction surveys Customer satisfaction surveys are vital tools for understanding what customers think, feel, and experience. Surveys provide a range of insights, from quick feedback after a purchase to in-depth assessments of brand loyalty. Measuring customer satisfaction is crucial for business growth.
Reveal Embedded Analytics For product owners, leveraging data is not just an advantageits a necessity. Product analytics empowers you to understand gaps in your offering and how users engage with your product. Both embedded analytics and product analytics are designed to help product owners in diverse ways.
Reveal Embedded Analytics We know how difficult it is to create dashboards, especially for web applications. However, running business operations or targeted campaigns without insights into their effectiveness is not an option. Thats what dashboards are for. It offers several options when it comes to dashboard libraries.
Most product teams get mobile app analytics wrong. They track 47 different key performance indicators (KPIs) in their mobile analytics platform , spend hours debating dashboard numbers, yet can’t predict which users will churn next week The problem here isn’t a lack of data.
A customer expansion strategy is a playbook for increasing the revenue from your existing customers, for example, by selling them additional products and services or encouraging them to upgrade to higher plans. For example, Zoom offers add-ons like audio conferencing, cloud storage, large meetings, or premium support.
Reveal Embedded AnalyticsData-driven companies have a hidden advantage! Theyve consistently outperformed their counterparts, reporting significantly higher metrics across operational efficiency (81% vs. 58%) , revenue growth (77% vs. 61%), and employee satisfaction (68% vs. 39%). How is this possible?
Even more startling, product managers reported spending 45% less time on strategy than theyd like in 2023. A 2022 Product Excellence Report revealed that only 36% of PMs are confident their products and features consistently meet customer expectations. Use this insight to refine your approach. Where did delays occur?
CFOs want tools that grow with the business and can support multiple teams—marketing, product, HR, and beyond. Bonus: Demonstrate how AI adds real value AI can be a major accelerator, especially when it comes to summarizing unstructured feedback, surfacing insights faster, and democratizing access to data. That’s a win.”
Reveal Embedded Analytics Today’s business users expect more than static dashboards or delayed reports. They want to explore live data, uncover insights, and take action in real time. Traditional BI tools were not built for embedded use cases. This is where embedded self-service BI comes in.
It’s what you do with the behavior data your app collects. And by behavior data, I dont mean installs (thats the easy part). Mobile app tracking captures data on how users interact with your app, including actions such as screen views, button taps, session length, and feature usage. What is mobile app tracking?
Nearly 60% of mobile teams still rely on self-hosted push tools. They trade short-term savings for long-term pain: no analytics, poor timing control, and zero personalization. If you want to build a push strategy that improves over time, you need proper analytics, A/B testing , and behavioral insights from day one.
And what I’ve learned is that, besides getting stakeholder buy-in, you need a solid process to collect high-quality data, organize user segments, and create story-driven personas that are easy to follow. But while the characters created in the process are fictional, their building blocks must be based on high-quality customer data.
Other gamification elements include: Rewards Badges Creativity tools Pressure Progress bars Challenges Explore more gamification examples. For example, can you host webinars to educate users about product updates and offer industry insights? Frequency of reported issue. No guesswork, just data. The result?
Their support team personally follows up, logs the conversation, and shares insights with leadership. Lesson 3: Let the data challenge your assumptions Tough feedback isn’t always easy to hear—but it’s essential. Lesson 4: Share feedback across the entire organization At Company Sage, feedback doesn’t stay hidden in dashboards.
How can we use neuromarketing to apply neuroscience insights about the brain into making financial products both efficient and emotionally rewarding. Financial institutions often believe in offering as much data as possibledetailed charts, extensive product catalogs and dense legaleseassuming it empowers customers.
The tools you use determine the depth of your behavioral segmentation capabilities. Basic analytics (e.g., Google Analytics) We don’t have a dedicated tool yet Advanced product analytics platforms How do you communicate with users based on their actions?
NPS survey dashboard in UsrGuiding tool. Also, when you rely on one metric, the risk of data manipulation increases. customers who had a smooth experience with a product or service). More data always leads to betterinsights Data is the new gold. These will provide more objective insights.
Ease of use and no-code building Powerful segmentation and user targeting Advanced analytics and A/B testing Seamless integration with our existing tech stack Ready to build the perfect onboarding wizard, code-free? Tooltip added to a Userpilot ’s analyticsdashboard. Hotspot added to a Userpilot ’s analyticsdashboard.
You join every stand-up, polish every deck, chase every “quick question”… yet somehow real decisions happen in a meeting you weren’t invited to. Hit Ctrl + Alt + PM Ctrl: Stop doing what algorithms crush overnight Meeting summaries, status decks, first-pass user stories. AI turns raw data into a story arc in seconds.
Established customer relationships and financial product stickiness (customers typically avoid switching to other finance service) lead to high retention rates. high-value customers or frequent purchasers), you can reveal actionable insights about this group of customers. Tracking retention in Google Analytics. increased churn).
Tracking the right user metrics helps you precisely identify issues in the product experience rather than feeling lost in a sea of data. In this article, Ill cover 10 crucial user metrics every product manager should track to turn data into decisions that increase product adoption. Emphasis is on the word right. Time to value.
We rely on our sales team’s notes We look at analytics, but lack qualitative insight We’re not sure where users get stuck What if you could guide users to value, contextually, inside your app? However, they struggled with fragmented tools, slow feature adoption, and scattered product insights.
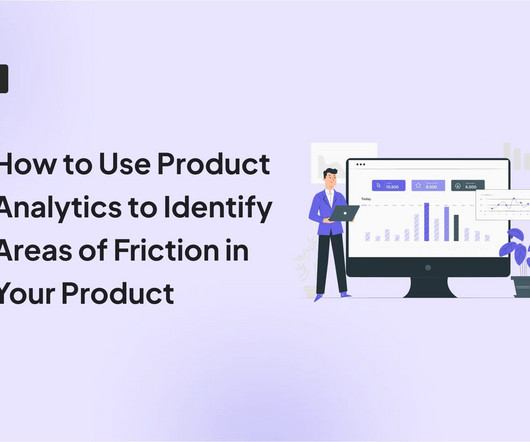
And thats where using product analytics can help. How to identify friction points with product analytics. Lets understand the types of friction that hinder user retention: A visual hierarchy of friction points. How to identify friction points with product analytics? What to do once you find friction points.
According to the Nielsen Norman Group, quantitative data can identify where users encounter problems, but it often fails to explain why those problems occur Nielsen Norman Group,2023. The Emergence of Research-Driven Growth Authentic growth lies not only in analyzing quantitative data but in deeply understanding user behavior and motivations.
Moreover, the product pages were shrouded in ambiguity, not providing the clarity and insightful descriptions necessary for coaxing a credit card out of hibernation. Indeed, as data suggests , streamlining the path users take through a website can significantly improve conversion funnels. Yes, you heard right75%.
The key isnt just understanding users but unlocking insights that lead to solutions they cant live without. Without a clear understanding of these factors, products risk failing to meet real-world demands. Without a clear understanding of these factors, products risk failing to meet real-world demands.
The right platform will equip you with the tools to interact effectively, gather valuable feedback, and build lasting customer relationships. How I chose the best customer engagement software My evaluation process combined thorough feature analysis , a careful review of user feedback, and insights from industry reports.
Todays Fintech disruptors and neobanks are igniting our brains reward centers with flashy visuals, gamified challenges and social interactivity that practically beg us to keep coming back for more. It ultimately changes how we think about financial services. Today, clients expect more than a basic straightforward financial service.
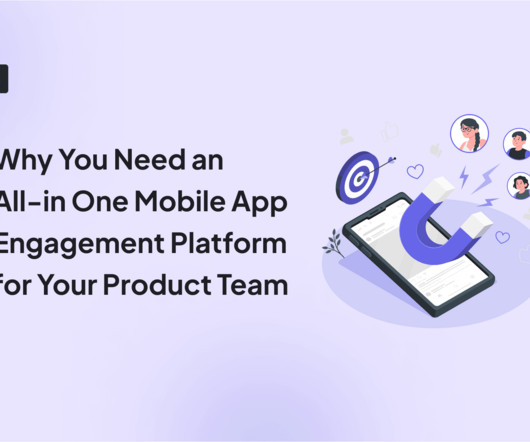
However, fragmented tools can’t meet these expectations. They often cause inconsistent interactions and data silos that leave your team guessing and your users frustrated. The answer is a single mobile customer engagement platform that combines onboarding, push notifications, and analytics to improve user engagement.
App engagement metrics provide quantitative insights into user interactions with your app. Based on this insight, you could redesign the feature or offer more in-app guidance to increase feature interaction. What matters now is how you act on this data. What are app engagement metrics?
When data stays siloed by channel—store surveys over here, app reviews over there—it’s nearly impossible to connect the dots and holistically understand the full customer experience. But without a connected system for collecting and acting on those signals, valuable insights get lost. It can cost them loyalty, revenue, and relevance.
Mayur Kamat is the chief product officer at N26—a $9 billion neobank serving over 7 million customers in 25 countries—where he leads product, design, data, and research. Founder CZ kept about 55 direct reports so individual contributors were never more than one level away from the CEO. Simplify security.
While Pendo is known for its top-notch product analytics and in-app guidance features, the mobile offering often receives mixed feedback, especially regarding pricing, implementation complexity, and feature limitations. A self-service hub where users can find documentation, FAQs, and guides. Dashboards. Resource center.
Imagine release notes that are more than text enhanced with screenshots , videos , and enhanced by feedback tools like Usersnap. Visuals are your secret weapon here. Show, dont just tell : Add visuals (GIFs, videos) to make updates easier to understand. Add visuals to enhance understanding.
Youll also see how Userpilots all-in-one localization, onboarding, and analytics features make the process easier. What is mobile app localization (and what its not) Mobile app localization is the process of adapting a mobile application to meet the linguistic, cultural, and technical requirements of a target market.
For sales teams, its a struggle to close without having relevant data or contacts. In this article, well share insights directly from Charley Longfellow, Head of Sales at Userpilot. And its also true for companies with investors and stakeholders who want to see predictable revenue in the bottom line.
Moreover, by investing in Userpilots resource center, you not only reduce reliance on your support team but can also take full advantage of it through self-service and enhance the product experience. Videos : You can embed video tutorials to provide visual guidance to users. Userpilot resource center analytics.
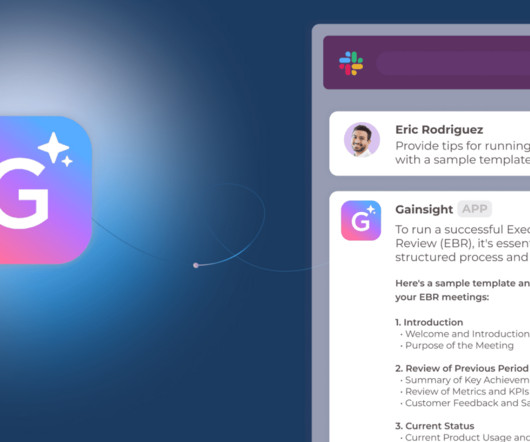
Getting Critical Customer Data to Everyone Who Needs It Teams are managing more customers, with higher expectations (internally or externally), and tighter budgetsyet no extra hands to keep up. Immediate access to a 360 view of customer data. Immediate access to a 360 view of customer data.
We organize all of the trending information in your field so you don't have to. Join 96,000+ users and stay up to date on the latest articles your peers are reading.
You know about us, now we want to get to know you!
Let's personalize your content
Let's get even more personalized
We recognize your account from another site in our network, please click 'Send Email' below to continue with verifying your account and setting a password.


Let's personalize your content