Remove Dashboard Remove Embedded Analytics Remove Management Remove Testing
article thumbnail

Embedding Self-Service BI in Blazor ApplicationsĀ 

Reveal

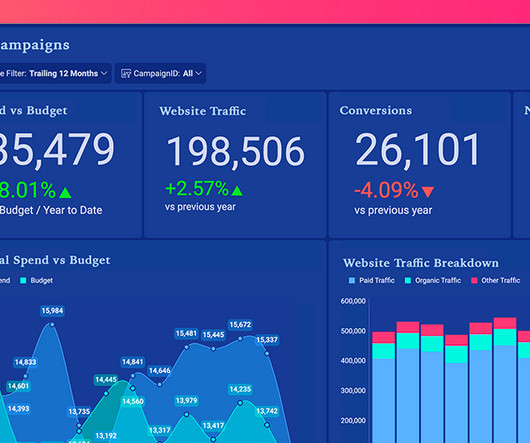
Reveal Embedded Analytics With abundant data, users have shifted to a data-first approach to guide their decision-making process. Integrating powerful BI with fully interactive visuals and reports into your Blazor applications makes data analytics accessible to all your end-users. And it’s easy to see why.

article thumbnail

15 Best User Behavior Analytics Tools in 2024

Userpilot

User behavior analytics tools are an essential part of the modern product manager’s toolkit. This article explores the top behavioral analytics tools to help you choose the right one for your needs. This article explores the top behavioral analytics tools to help you choose the right one for your needs.

Insiders

Sign Up for our Newsletter

This site is protected by reCAPTCHA and the Google Privacy Policy and Terms of Service apply.

article thumbnail

Digital Analytics 101: What Is It and How to Collect Digital Data?

Userpilot

What’s digital analytics? In this article, we also look at different kinds of digital analytics data, how to implement a digital analytics strategy, and the best tools to help you do it! TL;DR Digital analytics allows teams to measure and analyze product performance to improve their digital strategy. Are you in?

article thumbnail

How Gainsightā€™s Manager of CS Operations Improves Efficiency With Horizon Analytics

Gainsight

With the recent release of Gainsightā€™s Horizon Analytics, my team and I started using the beta versionā€™s tools and functions as soon as they were available. It has been four months into the testing process, and I have to say the results are exciting. Analytics – Simplified. Centralized Data Visualization.

article thumbnail

12 Best Typeform Alternatives You Might Want to Consider in 2023

Userpilot

Userpilot NPS Dashboard. The real power of Userpilot surveys, however, lies in the built-in analytics dashboard. In addition to a specialized NPS dashboard, you get a general dashboard for tracking, visualizing, and analyzing survey responses. Analyze survey responses on a simple dashboard. SurveyMonkey.

article thumbnail

UX Research Process: A Step-By-Step Framework

Userpilot

It also outlines a 9-step guide on how to conduct UX research for product managers and UX designers. The UX research process consists of 4 main stages, Discovery , Exploring, Testing, and Listening, which follow the development process and during which it becomes increasingly more specific. Why is it important? What are its stages?

article thumbnail

10 Best Data Visualization Platforms for Product Managers

The Product Coalition

Why is Data Visualization important for Product Managers? As a Product Manager, you may be working in partnership with a Product Ops Manager on data visualization. While you donā€™t have to be a Data Scientist to be a Product Manager, you have to be comfortable with data. Itā€™s important to get comfortable with them.