This site uses cookies to improve your experience. To help us insure we adhere to various privacy regulations, please select your country/region of residence. If you do not select a country, we will assume you are from the United States. Select your Cookie Settings or view our Privacy Policy and Terms of Use.
Cookie Settings
Cookies and similar technologies are used on this website for proper function of the website, for tracking performance analytics and for marketing purposes. We and some of our third-party providers may use cookie data for various purposes. Please review the cookie settings below and choose your preference.
Used for the proper function of the website
Used for monitoring website traffic and interactions
Cookie Settings
Cookies and similar technologies are used on this website for proper function of the website, for tracking performance analytics and for marketing purposes. We and some of our third-party providers may use cookie data for various purposes. Please review the cookie settings below and choose your preference.
Strictly Necessary: Used for the proper function of the website
Performance/Analytics: Used for monitoring website traffic and interactions
Featuring an engaging discussion with Inis Hormann (Marketing Director Germany, Cepheid) and Steve Kury (Leadership Development Consultant, SHK Leadership Consulting), the session provided actionable insights for PMs at every level. Leverage Data: Use findings to guide decisions, reduce uncertainty, and inform future product iterations.
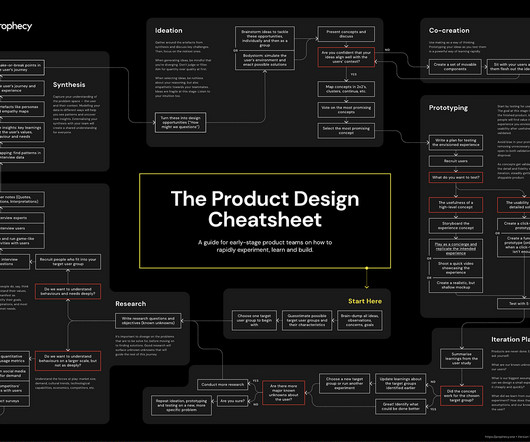
Using a custom ChatGPT model combined with collaborative team workshops, product teams can rapidly move from initial customer insights to validated prototypes while incorporating strategic foresight and market analysis. Instead of focusing solely on today’s customer problems, product teams need to look 2-5 years into the future.
For example, if your brand centers around being a data-driven decision-maker, ensure that your communications emphasize this. Share case studies, write posts that highlight your analytical approach, and offer insights backed by data. Share your learnings through social media, presentations, or internal discussions.
Proactive Problem Solving Doug was motivated to write Proactive Problem Solving by two pieces of data showing the impact of reactive problem solving: The average manager wastes 3.5 When presenting new ideas, especially those that challenge existing systems, people naturally feel stress. hours every day dealing with problems.
Embedding dashboards, reports and analytics in your application presents unique opportunities and poses unique challenges. We interviewed 16 experts across business intelligence, UI/UX, security and more to find out what it takes to build an application with analytics at its core.
You know your product collects tons of data. Datavisualizationtools help turn your messy spreadsheets into clear, interactive insights. The best ones dont even need SQL or data science skills. Because product analytics should be easy and accessible for everyone, not just data experts.
Introduction to customer satisfaction surveys Customer satisfaction surveys are vital tools for understanding what customers think, feel, and experience. Surveys provide a range of insights, from quick feedback after a purchase to in-depth assessments of brand loyalty. Don’t worry, we’ve got you.
Drawing from his 20+ years of technology experience and extensive research, Nishant shared insights about how these activities vary across different organizational contexts – from startups to enterprises, B2B to B2C, and Agile to Waterfall environments.
James shares insights from his research studying companies that consistently launch successful products. James shares that many teams are now working with their second or third generation of AI tools, particularly in sales and marketing. This makes product launches valuable testing grounds for innovation.
Organizations look to embedded analytics to provide greater self-service for users, introduce AI capabilities, offer better insight into data, and provide customizable dashboards that presentdata in a visually pleasing, easy-to-access format.
You see, although we work hard to make Userpilot the best product adoption tool on the market, we know it isnt the perfect fit for every business. Robust resource center functionalities for offering self-service help. Custom dashboards to track key metrics at a glance. for collecting user sentiment data.
Pro Tip: Pair your quick wins with data. A dashboard showing metrics like feature adoption or user engagement amplifies your credibility. Advanced Tactics: Stakeholder Mapping: Use tools like the Stakeholder Alignment Blueprint (available on jonihoadley.com) to identify key goals and concerns. Click here to download.
Most product teams get mobile app analytics wrong. They track 47 different key performance indicators (KPIs) in their mobile analytics platform , spend hours debating dashboard numbers, yet can’t predict which users will churn next week The problem here isn’t a lack of data.
The collaboration between AMS and MIT researchers has yielded impressive results, with AI tools not only matching human analysts in identifying customer needs but often exceeding themespecially for emotional needs that humans might overlook. But it is changing, with AI tools that are transforming how we uncover and analyze customer needs.
Speaker: Dean Yao, Director of Marketing at Jinfonet
What's the next big trend in analytics software and applications? You've probably used it without even knowing: embedded reporting and analytics. Software development teams more often now are embedding 3rd party analytics solutions into their products and applications to let them focus on other core areas of their software.
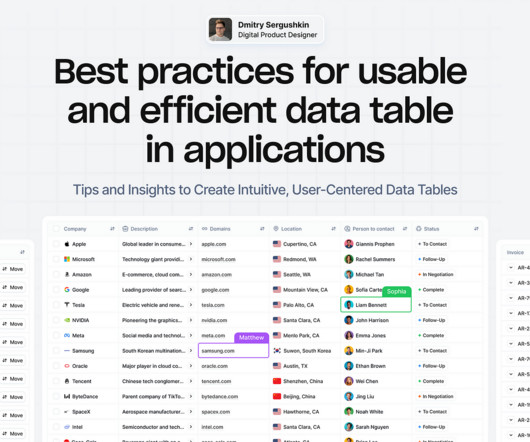
Tips and Insights to Create Intuitive, User-Centered DataTables Data tables provide a structured way to organize and manage information, making it easier to analyze and visualizedata effectively. However, creating effective data tables is not as simple as organizing rows and columns.
Below is a preview of key insights. Make switching easier Allow parallel use with existing tools and automate data migration from competitors. Create a self-initiated MVP even a simple landing page or automation tool. Q: How do I shift leaderships focus from data obsession to actual product development?
Reveal Embedded AnalyticsData-driven companies have a hidden advantage! Theyve consistently outperformed their counterparts, reporting significantly higher metrics across operational efficiency (81% vs. 58%) , revenue growth (77% vs. 61%), and employee satisfaction (68% vs. 39%). How is this possible?
Case Study: Improving Data-Driven Decision Making for CSR Leadership Civian is a data-driven platform designed to help businesses measure, optimize, and showcase the social and economic impact of their investments in communities. Feature Engagement Users most frequently gravitated toward the map to explore and compare data.
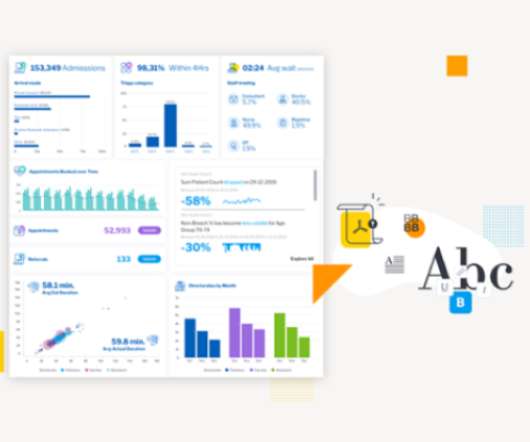
In this blog, we explore 5 key principles that exist to ensure you create a relevant dashboard that guides and simplifies the user experience, makes it as easy as possible to interpret what is presented no matter its complexity, and increases the adoption of BI.
Whether you’re already deep into AI tools or just getting started, you’ll learn what tools you should be paying attention to, which tool to use when, and how to get unstuck when you run into an issue. Choosing your tooling Current AI development tools come in three types: Chatbots (e.g.
Well start with an overview and explore how AI can take on tasks such as analyzing user data and automated prototyping to help professionals connect with users on a humanlevel. These advancements are revolutionizing how designers approach their work, making UX more data-driven, efficient, and user-focused than everbefore.
Note that Ive decided not to state the names of the tools I found, partly as the AI landscape is changing rapidly and partly as you should research and select the tools that work best in your context rather than trusting my judgment. [2] 2] Market Research AI-based tools can discover user and customer trends using predictiveanalytics.
In fact, the 2024 Buyer Experience Report by 6sense found that a whopping 85% of buyers establish purchase requirements before even contacting sales. Step 2: Collect internal assets Once you’ve decided on your use case, it’s time to dig into your internal assets to gather crucial customer data. moments along your customer journey.
Speaker: speakers from Verizon, Snowflake, Affinity Federal Credit Union, EverQuote, and AtScale
Join this webinar panel for practical advice on how to build and foster a data literate, self-service analysis culture at scale using a semantic layer. In this webinar you will learn about: Making data accessible to everyone in your organization with their favorite tools.
In our latest Productside webinar, Becoming an Effective Product Management Leader , Principal Consultants Roger Snyder and Kenny Kranseler delivered a no-nonsense roadmap for new leaders who want to nail their first 90 days (and beyond) and get the tools on how to become a product management leadereffectively. Show them the data they lack.
Tracking user behavior analytics in mobile apps is a whole different challenge compared to the web. Without a global DOM or easy auto-capture tools, tracking mobile app user behavior takes more planning. And the behavioral data you do collect depends on what you choose to track and how you track it. Mobile analytics ?
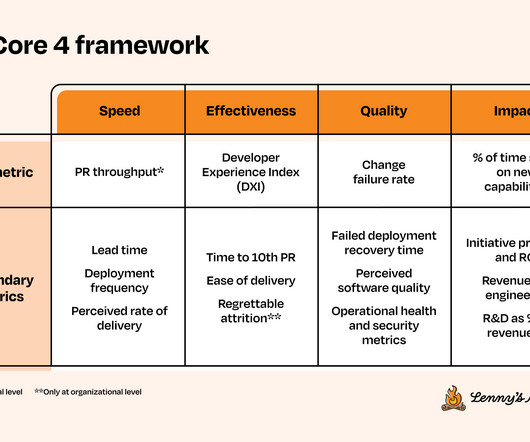
Her background is in developer tools and distributed systems. Quantitative measurements provide insight into what is happening, but qualitative insights tell us why. With Core 4, you can collect a baseline measurement via self-reported metrics. For more, check out her LinkedIn and her blog.
Through these insights, you’ll be better equipped to handle the pressures of managing up and leading your product toward success. Often, these requests are made without supporting data or customer feedback, which can create tension between PMs and top-level executives. Use data to support your position and explain the trade-offs.
Speaker: Laura Klein, Principal at Users Know and Author of UX for Lean Startups
That's why Laura Klein, product manager and UX designer, has a set of tips to help application teams improve their embedded dashboards and reports. How to avoid common mistakes people make when presentingdata. And yet we have so many of them in our lives. October 25, 2018 12:30 PM PST, 3:30 PM EST, 8:30 PM GMT
From Raw Data to Clarity — Cleaning, Sorting, and Synthesising Insights Part 4 (of 5) of the UX Research Playbook series Synthesising qualitative data is similar to reaping the harvest after the diligent effort poured into research — it’s the step where hard work blossoms into meaningful insights. Mural , Miro , etc.)
And Im not talking about pretty visuals for the sake of it. I mean frictionless, user-obsessed, data-driven design choices that guide your customer from just browsing to Add to Cart without ahiccup. In the bustling world of eCommerce, UX design isnt just a buzzword; its a strategic tool that can make or break your businesss success.
Listen to the audio version of this article: [link] A Product Strategy System The product strategy system in Figure 1 consists of four main parts: people, processes, principles, and tools. Are the right tools applied? Next, collect the relevant data. Are they properly empowered and adequately qualified? If so, what are they?
In this final part, well explore the broader landscape of common bias traps that can compromise your survey data and discuss strategies to minimise theirimpact. Be transparent in your reporting: At the end of your insightsreport or presentation, outline the scope and limitations of this round of surveys.
Speaker: Carrie Melissa Jones Founder, Gather Community Consulting
They can use insights, advice, and qualitative data about community members to build successful, promising communities. Register to get practical advice on how to: Present a case for why research matters to various parts of your organization. Make sure you don’t miss out on this incredibly insightful webinar!
AI-driven user testing, video insights, plus seamless app distribution and expert resourcesâ discover Centercode 10x. Platform Overview Managed Services Compare Plans What's New? Platform Scalable, Automated, Real-World User Testing Centercode is the leading platform to manage impactful in-the-wild user tests.
Quantitative data alone doesn’t reveal intent, only outcomes. By combining contextual insights from session replays , heatmaps, and behavior analytics, user session analysis helps you interpret metrics through the lens of real user journeys. Tools can track every click and interaction.
How can we use neuromarketing to apply neuroscience insights about the brain into making financial products both efficient and emotionally rewarding. Financial institutions often believe in offering as much data as possibledetailed charts, extensive product catalogs and dense legaleseassuming it empowers customers.
This stage involves gathering qualitative and quantitative data to understand the target users, their needs, behaviors, and pain points. Analyze quantitative data : Use quantitative methods such as surveys to collect data so you can rely on it during ideation. Research Research is the foundation of the product design process.
Use the companion calculator to model your own data, and present your findings with a ready-to-edit presentation template. Whether you're making the case to leadership or validating outsourcing, this toolkit gives you the numbers and tools you need.
How New Heuristics Are Reshaping the Creative Process Between Humans andMachines Image generated byChatGPT When the wave of generative AI tools began flooding the market, I must confess my reaction was mixed: a sense of fascination for the possibilities and concern for the ethical challenges looming on the horizon.
Organizations that rely on a single-channel feedback approach may overlook valuable insights. These missing insights are crucial for understanding customer needs and expectations. Omnichannel feedback allows businesses to capture insights from every touchpoint, creating a 360-degree view of the customer journey.
Pinterest, positioned uniquely as a visual discovery engine, has significant potential to leverage personalization to foster deeper user engagement, retention, andloyalty. Key insight for Pinterest: A platform can successfully combine social personalization (friends/following-based) with content personalization.
They include fixes, enhancements, and new features , related to the product's hardware, software, and services. Sunsetted features : Focused on features or services being retired, these notes inform users about timelines and provide alternatives. They are concise, reassuring users that identified problems have been resolved.
Speaker: Amanda Stockwell, President of Stockwell Strategy
However, if you're willing to adapt the right way, you don't have to sacrifice agility or user insights. Using the right strategy, your agile team will collect qualitative data, interpret it, and integrate it effectively. Data analysis and integration. In this webinar, she'll make specific suggestions around: Team makeup.
We organize all of the trending information in your field so you don't have to. Join 96,000+ users and stay up to date on the latest articles your peers are reading.
You know about us, now we want to get to know you!
Let's personalize your content
Let's get even more personalized
We recognize your account from another site in our network, please click 'Send Email' below to continue with verifying your account and setting a password.


Let's personalize your content