This site uses cookies to improve your experience. To help us insure we adhere to various privacy regulations, please select your country/region of residence. If you do not select a country, we will assume you are from the United States. Select your Cookie Settings or view our Privacy Policy and Terms of Use.
Cookie Settings
Cookies and similar technologies are used on this website for proper function of the website, for tracking performance analytics and for marketing purposes. We and some of our third-party providers may use cookie data for various purposes. Please review the cookie settings below and choose your preference.
Used for the proper function of the website
Used for monitoring website traffic and interactions
Cookie Settings
Cookies and similar technologies are used on this website for proper function of the website, for tracking performance analytics and for marketing purposes. We and some of our third-party providers may use cookie data for various purposes. Please review the cookie settings below and choose your preference.
Strictly Necessary: Used for the proper function of the website
Performance/Analytics: Used for monitoring website traffic and interactions
Listen to the audio version of this article: [link] A Product Strategy System The product strategy system in Figure 1 consists of four main parts: people, processes, principles, and tools. Like any system, it is a collection of interconnecting parts that function as a whole. Are the right tools applied?
How to plan a dashboard people will use: 10 Key Steps Dashboard user interface elements in light and dark modes Our team has built dashboards for a wide range of businesses, and we’ve picked up a few key insights along the way. A truly functional dashboard is always the result of collaboration.
hours daily fixing problems, with 75% of issues stemming from broken systems rather than employee mistakes. Even more concerning, products typically lose 50% of their innovative value during development as unique ideas get compromised to fit existing systems. Doug shared that the average manager wastes 3.5
This unique combination developed both her analytical thinking skills and her ability to question assumptions – capabilities that would later prove valuable in her product career. Over ten years, she rose through the ranks until everyone in the company reported to her.
ETL and ELT are some of the most common data engineering use cases, but can come with challenges like scaling, connectivity to other systems, and dynamically adapting to changing data sources. Airflow is specifically designed for moving and transforming data in ETL/ELT pipelines, and new features in Airflow 3.0
When your company adopts multiple SaaS solutions to drive productivity, you unknowingly create a perfect storm for data fragmentation. Your customer information lives in Salesforce, while your support tickets are in Zendesk, your product usage data in Mixpanel, and your marketing campaigns in HubSpot. Sound familiar?
Introduction to customer satisfaction surveys Customer satisfaction surveys are vital tools for understanding what customers think, feel, and experience. Surveys provide a range of insights, from quick feedback after a purchase to in-depth assessments of brand loyalty. Don’t worry, we’ve got you.
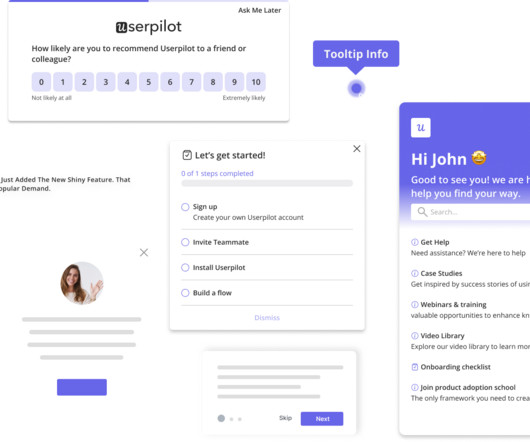
Let’s review everything your customer success team has to do in the absence of any customer success tools. Collect customer data to calculate complex formulas for tracking metrics, monitor customer health scores, and resolve support tickets while continuously trying to improve retention and expansion.
James shares insights from his research studying companies that consistently launch successful products. James shares that many teams are now working with their second or third generation of AI tools, particularly in sales and marketing. Building the Right Culture Culture plays a vital role in launch success.
Greg Loughnane and Chris Alexiuk in this exciting webinar to learn all about: How to design and implement production-ready systems with guardrails, active monitoring of key evaluation metrics beyond latency and token count, managing prompts, and understanding the process for continuous improvement Best practices for setting up the proper mix of open- (..)
How product managers are transforming innovation with AI tools Watch on YouTube TLDR In this deep dive into AI’s impact on product innovation and management, former PayPal Senior Director of Innovation Mike Todasco shares insights on how AI tools are revolutionizing product development.
Atif brings valuable insights from a recent PDMA executive workshop where leaders discussed their real-world challenges with strategic decision making and innovation strategy. In this episode, he shares some insights from that workshop and his experience in product leadership.
In the retail industry, customer feedback is your early warning system, your innovation engine, and your most honest performance review. But this system only works if you take action on the feedback collected. Heres how to take insights from customer feedback and turn them into results. Dont wait for quarterly NPS reports.
The collaboration between AMS and MIT researchers has yielded impressive results, with AI tools not only matching human analysts in identifying customer needs but often exceeding themespecially for emotional needs that humans might overlook. But it is changing, with AI tools that are transforming how we uncover and analyze customer needs.
Speaker: Anindo Banerjea, CTO at Civio & Tony Karrer, CTO at Aggregage
This can be especially difficult when working with a large data corpus, and as the complexity of the task increases. The number of use cases/corner cases that the system is expected to handle essentially explodes. When developing a Gen AI application, one of the most significant challenges is improving accuracy.
Most product teams get mobile app analytics wrong. They track 47 different key performance indicators (KPIs) in their mobile analytics platform , spend hours debating dashboard numbers, yet can’t predict which users will churn next week The problem here isn’t a lack of data.
The insights were buried in dashboards. And the noise around each new BI tool? In theory, leaders had access to more data than ever. In practice, they were still stuck waiting — for someone to pull the numbers, check the logic, and send the report. Insight delivered late is just expensive hindsight.
Reveal Embedded Analytics We know how difficult it is to create dashboards, especially for web applications. However, running business operations or targeted campaigns without insights into their effectiveness is not an option. Thats what dashboards are for. They track everything from user behavior to system performance.
A customer expansion strategy is a playbook for increasing the revenue from your existing customers, for example, by selling them additional products and services or encouraging them to upgrade to higher plans. As your team grows and you hire new people or other departments adopt the tool, the number of seats needed increases.
Download this Special Report by MIT Sloan Management Review to learn about: The concept of radicalness and how its intertwined with innovations Innovative governance ideas that have the potential to influence organizational changes Simple decisions that can set teams on a path toward either incremental or breakthrough innovations
Featuring live examples, a hands-on walkthrough of real automations, and a breakdown of tangible business impact, the session provides a clear view of how companies are integrating feedback into their external systems to inform decisions and strengthen customer relationships. Without logging into another tool. What about Excel?
Whether you’re already deep into AI tools or just getting started, you’ll learn what tools you should be paying attention to, which tool to use when, and how to get unstuck when you run into an issue. Choosing your tooling Current AI development tools come in three types: Chatbots (e.g.
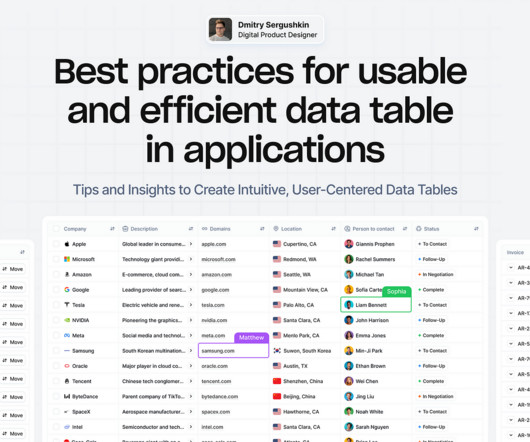
Tips and Insights to Create Intuitive, User-Centered DataTables Data tables provide a structured way to organize and manage information, making it easier to analyze and visualizedata effectively. However, creating effective data tables is not as simple as organizing rows and columns.
Reveal Embedded AnalyticsData-driven companies have a hidden advantage! Theyve consistently outperformed their counterparts, reporting significantly higher metrics across operational efficiency (81% vs. 58%) , revenue growth (77% vs. 61%), and employee satisfaction (68% vs. 39%). How is this possible?
But none of this is possible without the most important element of a successful ABM program: good data. Data is the fuel that powers your ABM engine. And yet only 43% of marketers are completely satisfied with the quality of their data. Without it, you can’t find and reach your target accounts.
Case Study: Improving Data-Driven Decision Making for CSR Leadership Civian is a data-driven platform designed to help businesses measure, optimize, and showcase the social and economic impact of their investments in communities. Feature Engagement Users most frequently gravitated toward the map to explore and compare data.
Its a tool. And tools only work when you know what youre building. Some examples: Optimizing operations: AI can streamline workflows, predict bottlenecks, and cut inefficiencies. Uncovering insights: Machine learning can analyze massive datasets and surface patterns youd never catch on your own. Saving time andmoney.)
Anya’s development of Taelor offers valuable lessons in how to validate and expand upon initial product insights. The service attracted a surprisingly diverse customer base, ranging from 16 to 85 years old, including professionals across various industries – from sales executives to pastors.
Well start with an overview and explore how AI can take on tasks such as analyzing user data and automated prototyping to help professionals connect with users on a humanlevel. These advancements are revolutionizing how designers approach their work, making UX more data-driven, efficient, and user-focused than everbefore.
But we can take the right actions to prevent failure and ensure that AI systems perform to predictably high standards, meet business needs, unlock additional resources for financial sustainability, and reflect the real patterns observed in the outside world.
This definition is a mouthful, so I like to visualize it. I’m going to walk through this visual quickly, and then Cecilie and I are going to dive into this in more depth. Using the Opportunity Solution Tree to Guide Discovery The visual at the center of this is called an opportunity solution tree. It’s that simple.
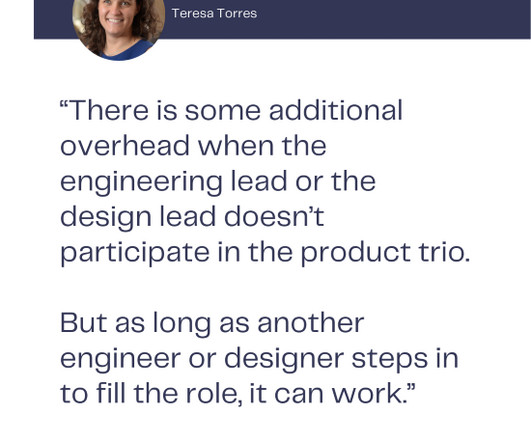
It is not expected (nor is it the norm) for the other designers on the team to report to the design lead nor for the other engineers on the team to report to the engineering lead. Our more senior engineer might be most interested in system architecture, code reviews, and mentoring other engineers. They lead product discovery.
Thats where real user monitoring tools come inthey provide real-time insights into how users engage with the app , helping you detect performance issues before they impact your bottom line. Third-party integration: Supports integration with analytics, and DevOps tools like Google Analytics, Mixpanel, Splunk, or Datadog.
Reveal Embedded Analytics Today’s business users expect more than static dashboards or delayed reports. They want to explore live data, uncover insights, and take action in real time. Traditional BI tools were not built for embedded use cases. This is where embedded self-service BI comes in.
Speaker: Patrick Dempsey and Andrew Erpelding of ZoomInfo
Find and connect with the right talent to fill roles fast with these tools: More data! Export results: Easily export candidate data (including contact info) to Excel, shared with colleagues to review or upload in bulk to a recruiter's applicant tracking system. What is ZoomInfo for Recruiters?
Transforming user experience in cars-as-a-service industry through Strategic AI/ML Integrationa UX casestudy. Overview This case study focuses on integrating AI/ML to improve user experience in the car-as-a-service automobile marketplace. Prompt samples based on real Data on how customers source for cars in rental marketplaces.
To better understand the common challenges organizations face with digital feedback tools, we conducted a comprehensive market research study that revealed several critical pain points. When one tool gathers feedback via email and another through your website, consolidating all that data and customer feedback can be nearly impossible.
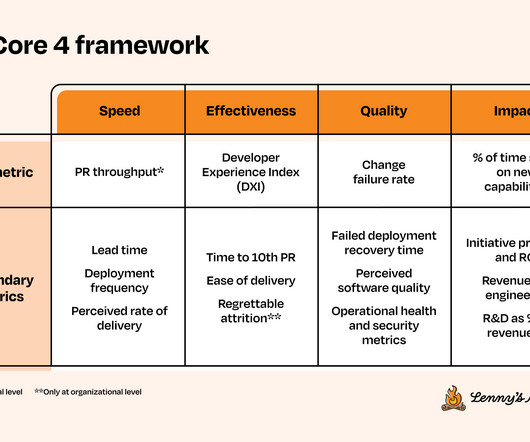
Her background is in developer tools and distributed systems. These metrics are designed to be used together as a system to provide a balanced look at overall team performance. It’s important that this metric is used only as a system health metric, and always alongside other metrics in the framework.
Delivering great AI customer service depends on more than just sophisticated AI models – it relies on real-time data and access to business systems like CRMs, billing platforms, and past conversations. With MCP, businesses can integrate AI faster, scale it across more systems, and deliver better support with less effort.
Whether it is the reliability of the supply chain, the accuracy of financial predictions, or the assurance of product availability, trust from customers, vendors, and suppliers is non-negotiable. How MLOps helps bridge the production gap between systems and teams. Trust is an essential part of doing business.
The Rules Are Blocking Your Progress These so-called “best practices” promise structure and alignment, but they often trap teams in a cycle of predictability and prevent breakthroughs. We know roadmaps provide structure, alignment, and predictability. Lets take them apart. and pursue the answers. Spoiler alertthey wont.
Nearly 60% of mobile teams still rely on self-hosted push tools. They trade short-term savings for long-term pain: no analytics, poor timing control, and zero personalization. This is where self-hosted systems often fail. Use user data (name, location, preferences, past behaviors) to send relevant, personalized notifications.
It’s what you do with the behavior data your app collects. And by behavior data, I dont mean installs (thats the easy part). Mobile app tracking captures data on how users interact with your app, including actions such as screen views, button taps, session length, and feature usage. What is mobile app tracking?
Tracking user behavior analytics in mobile apps is a whole different challenge compared to the web. Without a global DOM or easy auto-capture tools, tracking mobile app user behavior takes more planning. And the behavioral data you do collect depends on what you choose to track and how you track it. Mobile analytics ?
Think your customers will pay more for datavisualizations in your application? But today, dashboards and visualizations have become table stakes. Discover which features will differentiate your application and maximize the ROI of your embedded analytics. Brought to you by Logi Analytics.
We organize all of the trending information in your field so you don't have to. Join 96,000+ users and stay up to date on the latest articles your peers are reading.
You know about us, now we want to get to know you!
Let's personalize your content
Let's get even more personalized
We recognize your account from another site in our network, please click 'Send Email' below to continue with verifying your account and setting a password.


Let's personalize your content