This site uses cookies to improve your experience. To help us insure we adhere to various privacy regulations, please select your country/region of residence. If you do not select a country, we will assume you are from the United States. Select your Cookie Settings or view our Privacy Policy and Terms of Use.
Cookie Settings
Cookies and similar technologies are used on this website for proper function of the website, for tracking performance analytics and for marketing purposes. We and some of our third-party providers may use cookie data for various purposes. Please review the cookie settings below and choose your preference.
Used for the proper function of the website
Used for monitoring website traffic and interactions
Cookie Settings
Cookies and similar technologies are used on this website for proper function of the website, for tracking performance analytics and for marketing purposes. We and some of our third-party providers may use cookie data for various purposes. Please review the cookie settings below and choose your preference.
Strictly Necessary: Used for the proper function of the website
Performance/Analytics: Used for monitoring website traffic and interactions
Without effective UX analytics that goes beyond collecting data, you’re losing valuable customers. Unfortunately, the research backs this up, with a staggering 90% of users reporting that they stopped using an app due to poor performance. It covers key topics, such as: Defining UX analytics. What is UX analytics?
Featuring an engaging discussion with Inis Hormann (Marketing Director Germany, Cepheid) and Steve Kury (Leadership Development Consultant, SHK Leadership Consulting), the session provided actionable insights for PMs at every level. Leverage Data: Use findings to guide decisions, reduce uncertainty, and inform future product iterations.
Using a custom ChatGPT model combined with collaborative team workshops, product teams can rapidly move from initial customer insights to validated prototypes while incorporating strategic foresight and market analysis. Instead of focusing solely on today’s customer problems, product teams need to look 2-5 years into the future.
Think of Net Promoter Score (NPS) software as a tool to measure your customers’ feelings about your product, and categorize them based on their level of loyalty (promoters, neutrals, and detractors). The great advantage of these tools is that they streamline the creation, distribution, and analysis of NPS surveys.
Speaker: speakers from Verizon, Snowflake, Affinity Federal Credit Union, EverQuote, and AtScale
Join this webinar panel for practical advice on how to build and foster a data literate, self-serviceanalysis culture at scale using a semantic layer. In this webinar you will learn about: Making data accessible to everyone in your organization with their favorite tools.
While “use data to drive decision-making” sounds obvious, there’s a HUGE gap between saying it and doing it well. So, how do you get started with product analytics ? In this article, we’ll talk about: What product analytics is and why you need a solid strategy. What is product analytics?
You can gather all the user feedback or behavioral data you want or even generate tons of Google Analyticsreports. Despite all these efforts, you’re probably still not acting on product analytics correctly. Why actionable product analytics are important. This causes siloed data and integration issues.
He shares practical insights from the Product Development and Management Association (PDMA) framework and explains how product managers can use these principles to improve their product development process. Portfolio Management During our conversation, Jack shares valuable insights from managing product portfolios at Sony Ericsson.
Drawing from his 20+ years of technology experience and extensive research, Nishant shared insights about how these activities vary across different organizational contexts – from startups to enterprises, B2B to B2C, and Agile to Waterfall environments.
The world of BI and analytics has evolved. Discover the five styles of reporting and analysis, and learn the pros and cons of each in an enterprise scenario.
This unique combination developed both her analytical thinking skills and her ability to question assumptions – capabilities that would later prove valuable in her product career. Over ten years, she rose through the ranks until everyone in the company reported to her.
Introduction to customer satisfaction surveys Customer satisfaction surveys are vital tools for understanding what customers think, feel, and experience. Surveys provide a range of insights, from quick feedback after a purchase to in-depth assessments of brand loyalty. Don’t worry, we’ve got you.
Reveal Embedded Analytics For product owners, leveraging data is not just an advantageits a necessity. Product analytics empowers you to understand gaps in your offering and how users engage with your product. Both embedded analytics and product analytics are designed to help product owners in diverse ways.
Let’s review everything your customer success team has to do in the absence of any customer success tools. Collect customer data to calculate complex formulas for tracking metrics, monitor customer health scores, and resolve support tickets while continuously trying to improve retention and expansion.
Speaker: Evan Leong - CEO & Founder, Product Signals
How do industry leaders like Apple and Amazon successfully leverage customer and market insights to enhance their products, even with vast customer bases and extensive market data? Despite its significance, many organizations struggle to collect and utilize feedback appropriately.
You know your product collects tons of data. Datavisualizationtools help turn your messy spreadsheets into clear, interactive insights. The best ones dont even need SQL or data science skills. Because product analytics should be easy and accessible for everyone, not just data experts.
Atif brings valuable insights from a recent PDMA executive workshop where leaders discussed their real-world challenges with strategic decision making and innovation strategy. In this episode, he shares some insights from that workshop and his experience in product leadership.
How product managers are transforming innovation with AI tools Watch on YouTube TLDR In this deep dive into AI’s impact on product innovation and management, former PayPal Senior Director of Innovation Mike Todasco shares insights on how AI tools are revolutionizing product development.
You see, although we work hard to make Userpilot the best product adoption tool on the market, we know it isnt the perfect fit for every business. Robust resource center functionalities for offering self-service help. Custom dashboards to track key metrics at a glance. for collecting user sentiment data.
The collaboration between AMS and MIT researchers has yielded impressive results, with AI tools not only matching human analysts in identifying customer needs but often exceeding themespecially for emotional needs that humans might overlook. But it is changing, with AI tools that are transforming how we uncover and analyze customer needs.
Proactive Problem Solving Doug was motivated to write Proactive Problem Solving by two pieces of data showing the impact of reactive problem solving: The average manager wastes 3.5 These principles aren’t just theoretical – they’re practical tools that any product team can implement to enhance their innovation process.
Most product teams get mobile app analytics wrong. They track 47 different key performance indicators (KPIs) in their mobile analytics platform , spend hours debating dashboard numbers, yet can’t predict which users will churn next week The problem here isn’t a lack of data.
A customer expansion strategy is a playbook for increasing the revenue from your existing customers, for example, by selling them additional products and services or encouraging them to upgrade to higher plans. As your team grows and you hire new people or other departments adopt the tool, the number of seats needed increases.
Think your customers will pay more for datavisualizations in your application? But today, dashboards and visualizations have become table stakes. Discover which features will differentiate your application and maximize the ROI of your embedded analytics. Brought to you by Logi Analytics.
When you’re building a mobile product , data is your lifeline. Whether for tracking feature adoption or spotting drop-off points, the right analyticstool can make or break your growth. Some tools are great for marketers, and others are for product or development teams.
Quantitative data alone doesn’t reveal intent, only outcomes. Thats why you need user session analysis. By combining contextual insights from session replays , heatmaps, and behavior analytics, user session analysis helps you interpret metrics through the lens of real user journeys.
The choice is tough because there’s no single tool that covers all use cases. What’s worse, you will find multiple tools in each category, making it incredibly difficult to pick the tool that satisfies your needs and offers the best value for money. Which product feedback software should you choose for your SaaS?
Put simply, we craft smart products that transform mundane shopping experiences into personalized adventures, like suggesting the perfect pair of sneakers based on your unique sports styleall thanks to PredictiveAnalysis. Curious to learn more? Keepreading! So, how does everything unfold?
Speaker: Speakers from SafeGraph, Facteus, AWS Data Exchange, SimilarWeb, and AtScale
Data and analytics leaders across industries can benefit from leveraging multiple types of diverse external data for making smarter business decisions. Data and analytics specialists from AWS Data Exchange and AtScale will walk through exactly how to blend and operationalize these diverse data external and internal sources.
Think about all the insights you could gather to improve the user experience. By showing how users interact with different elements on the page or product screen, session replays provide product teams , designers, and marketers with valuable insights into user behavior. Every click, scroll, hover, or keystroke?
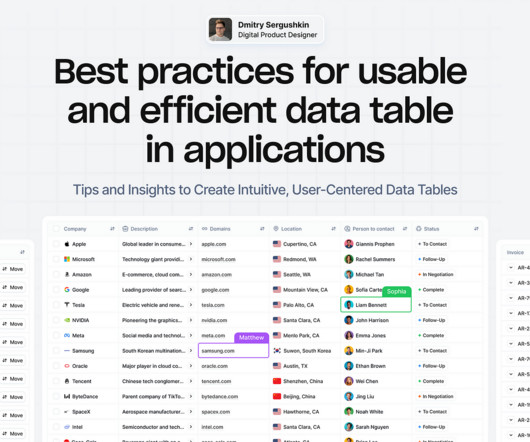
Tips and Insights to Create Intuitive, User-Centered DataTables Data tables provide a structured way to organize and manage information, making it easier to analyze and visualizedata effectively. However, creating effective data tables is not as simple as organizing rows and columns.
Are you struggling to make sense of scattered user data? The right customer analytics platform helps you uncover exactly how customers interact with your product: so you can spot issues early, optimize user journeys, and drive sustainable growth. Choose the best fit for your needs and transform data into actionable strategies.
In 2006, British mathematician Clive Humby made the infamous statement: Data is the new oil. Like oil, raw data needs to be refined, processed and turned into something useful because its value lies in its potential. Unfortunately, most people have yet to understand what it truly means to use data. moment that makes users stick.
Download this whitepaper to learn what contextual analytics is, how BI platforms like Yellowfin revolutionize the way users discover insights from their data with native contextual analytics, and how it adds value to your software solution by elevating the user experience.
This definition is a mouthful, so I like to visualize it. I’m going to walk through this visual quickly, and then Cecilie and I are going to dive into this in more depth. Using the Opportunity Solution Tree to Guide Discovery The visual at the center of this is called an opportunity solution tree. It’s that simple.
Case Study: Improving Data-Driven Decision Making for CSR Leadership Civian is a data-driven platform designed to help businesses measure, optimize, and showcase the social and economic impact of their investments in communities. Feature Engagement Users most frequently gravitated toward the map to explore and compare data.
How Companies Are Funding User Research in 2025: Insights from the User Interviews Research Budget Report User Interviews 2025 Research Budget Report is a crucial resource for understanding how modern organizations are approaching the financial side of user research. Only 17% experienced reductions. Lets unpack each.
Well start with an overview and explore how AI can take on tasks such as analyzing user data and automated prototyping to help professionals connect with users on a humanlevel. These advancements are revolutionizing how designers approach their work, making UX more data-driven, efficient, and user-focused than everbefore.
An interactive guide filled with the tools to turn your data into a competitive advantage. They rely on data to power products, business insights, and marketing strategy. This playbook contains: Exclusive statistics, research, and insights into how the pandemic has affected businesses over the last 18 months.
Note that Ive decided not to state the names of the tools I found, partly as the AI landscape is changing rapidly and partly as you should research and select the tools that work best in your context rather than trusting my judgment. [2] 2] Market Research AI-based tools can discover user and customer trends using predictiveanalytics.
Thats where real user monitoring tools come inthey provide real-time insights into how users engage with the app , helping you detect performance issues before they impact your bottom line. User journey analysis : Tracks the flow of users across pages to detect drop-offs. Weve done the research for you!
It’s what you do with the behavior data your app collects. And by behavior data, I dont mean installs (thats the easy part). Mobile app tracking captures data on how users interact with your app, including actions such as screen views, button taps, session length, and feature usage. What is mobile app tracking?
Reveal Embedded Analytics Today’s business users expect more than static dashboards or delayed reports. They want to explore live data, uncover insights, and take action in real time. Traditional BI tools were not built for embedded use cases. This is where embedded self-service BI comes in.
Speaker: Eric Feinstein, Professional Services Manager, Looker
For a long time, Product Managers have found it challenging to design interfaces inside their products that users could use for reporting. It seems like PMs and engineers have grown to hate embedded reporting. How to evaluate embedded analytic solutions as strategy to greatly reduce initial and on-going engineering effort.
We organize all of the trending information in your field so you don't have to. Join 96,000+ users and stay up to date on the latest articles your peers are reading.
You know about us, now we want to get to know you!
Let's personalize your content
Let's get even more personalized
We recognize your account from another site in our network, please click 'Send Email' below to continue with verifying your account and setting a password.


Let's personalize your content