article thumbnail

How Can Brand Monitoring Improve Product Design and User Feedback?

Userpilot

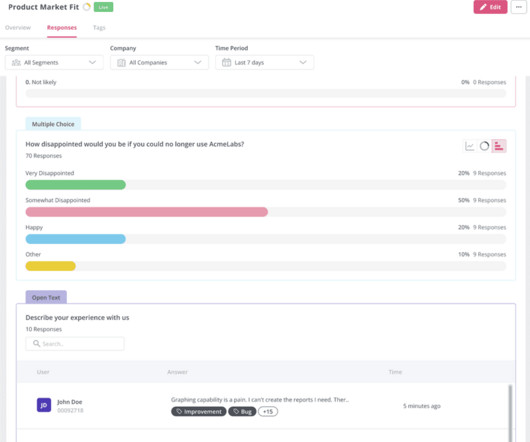
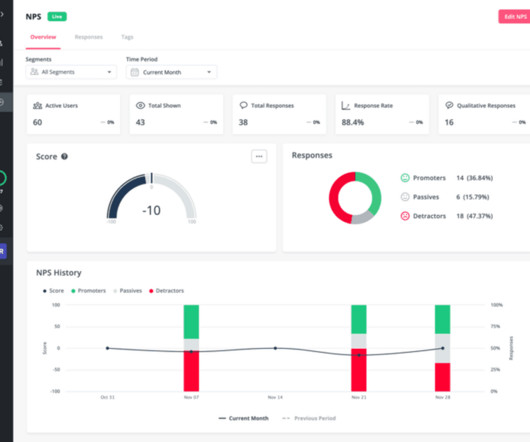
Brand monitoring is a crucial part of any product’s development process. What is brand monitoring? Brand monitoring is the tasks and activities you do that help you track and monitor what people say about your product and brand across multiple channels. How can brand monitoring help your business?

article thumbnail

How to Track User Sentiment in SaaS: Steps and Tools

Userpilot

TL;DR User sentiment is the feeling a person has about your brand, product, or service quality. Brand24 – best for brand sentiment analysis. User sentiment, also known as customer sentiment, refers to how users feel about a product, service, brand, or even an industry. Sentiment Analysis Examples.

Insiders

Sign Up for our Newsletter

This site is protected by reCAPTCHA and the Google Privacy Policy and Terms of Service apply.

Trending Sources

article thumbnail

12 Best Customer Insight Tools for SaaS Companies in 2024

Userpilot

TL;DR Customer insight platforms enable informed business decisions by analyzing customer behaviors and preferences to improve products and experiences. This enables companies to make informed decisions, tailor products, and improve customer experiences based on a deep understanding of customer needs and trends. Read on to learn more.

article thumbnail

What is User Engagement Analysis? Top 9 Metrics to Track

Userpilot

Customer engagement is a wider concept than user engagement encompassing customer interactions with the brand across all customer journey stages. AI writing assistants help teams make their microcopies concise but informative and engaging. Core feature engagement dashboard in Userpilot. Keep them engaged.

article thumbnail

Monetizing Analytics Features: Why Data Visualizations Will Never Be Enough

But today, dashboards and visualizations have become table stakes. Think your customers will pay more for data visualizations in your application? Five years ago they may have. Discover which features will differentiate your application and maximize the ROI of your embedded analytics. Brought to you by Logi Analytics.

article thumbnail

DIY Data Visualizations: Provide Unique Insights of Your Data with Reveal BI 

Reveal

By arranging data elements and visuals in a narrative, you can guide your audience through a logical flow of information, leading decision-makers toward actionable insights. With our innovative addition to the platform, you can now take control of the chart types available within your dashboards. But that’s not all.

article thumbnail

Get Ready for an Exciting 2024: Reveal’s New Features Unveiled 

Reveal

New Toolbar for Enhanced Visualization Control The centerpiece of our 2024 feature lineup is the brand-new toolbar. With it, you will be able to personalize your visualizations to match your brand or preferences and define specific colors for your series to create visually appealing and informative charts. In addition, our 1.6.0