This site uses cookies to improve your experience. To help us insure we adhere to various privacy regulations, please select your country/region of residence. If you do not select a country, we will assume you are from the United States. Select your Cookie Settings or view our Privacy Policy and Terms of Use.
Cookie Settings
Cookies and similar technologies are used on this website for proper function of the website, for tracking performance analytics and for marketing purposes. We and some of our third-party providers may use cookie data for various purposes. Please review the cookie settings below and choose your preference.
Used for the proper function of the website
Used for monitoring website traffic and interactions
Cookie Settings
Cookies and similar technologies are used on this website for proper function of the website, for tracking performance analytics and for marketing purposes. We and some of our third-party providers may use cookie data for various purposes. Please review the cookie settings below and choose your preference.
Strictly Necessary: Used for the proper function of the website
Performance/Analytics: Used for monitoring website traffic and interactions
Introduction to customer satisfaction surveys Customer satisfaction surveys are vital tools for understanding what customers think, feel, and experience. Surveys provide a range of insights, from quick feedback after a purchase to in-depth assessments of brand loyalty. Don’t worry, we’ve got you.
In the retail industry, customerfeedback is your early warning system, your innovation engine, and your most honest performance review. But this system only works if you take action on the feedback collected. Heres how to take insights from customerfeedback and turn them into results.
Without effective UX analytics that goes beyond collecting data, you’re losing valuable customers. Unfortunately, the research backs this up, with a staggering 90% of users reporting that they stopped using an app due to poor performance. Basically, anything that ruins the user experience. What is UX analytics?
In this digital-first world, understanding your customers’ experiences is more crucial than ever. To better understand the common challenges organizations face with digital feedback tools, we conducted a comprehensive market research study that revealed several critical pain points.
Think your customers will pay more for data visualizations in your application? But today, dashboards and visualizations have become table stakes. Five years ago they may have. Discover which features will differentiate your application and maximize the ROI of your embedded analytics. Brought to you by Logi Analytics.
When your company adopts multiple SaaS solutions to drive productivity, you unknowingly create a perfect storm for data fragmentation. Your customer information lives in Salesforce, while your support tickets are in Zendesk, your product usage data in Mixpanel, and your marketing campaigns in HubSpot. Sound familiar?
Ever wonder why some products instantly click with users while others get abandoned faster than New Year’s resolutions? The secret often lies in those crucial first moments – your user onboarding. But here’s the thing: getting users to say “wow” instead of “why?”
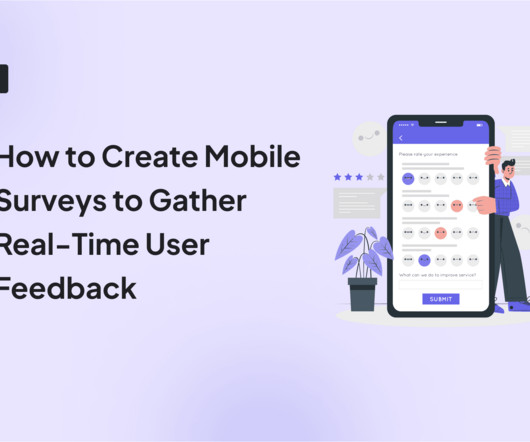
With 85% of adults keeping their smartphones within arm’s reach at all times, mobile surveys have become the most direct route to gathering authentic userfeedback. Companies that simply shrink their desktop questionnaires to fit smaller screens end up with frustrated users and compromised data.
Think of Net Promoter Score (NPS) software as a tool to measure your customers’ feelings about your product, and categorize them based on their level of loyalty (promoters, neutrals, and detractors). 1 Userpilot for product teams to collect and act on NPS data Creating NPS surveys with Userpilot.
Organizations look to embedded analytics to provide greater self-service for users, introduce AI capabilities, offer better insight into data, and provide customizable dashboards that present data in a visually pleasing, easy-to-access format.
You can gather all the userfeedback or behavioral data you want or even generate tons of Google Analytics reports. He’s passionate about creating beautiful yet simple solutions to complex problems, aiming to empower all users to self-serve. This causes siloed data and integration issues.
Case Study: Improving Data-Driven Decision Making for CSR Leadership Civian is a data-driven platform designed to help businesses measure, optimize, and showcase the social and economic impact of their investments in communities. Through our screening questions, we were able to tap into mirroring Civians user group quite accurately.
Let’s review everything your customer success team has to do in the absence of any customer success tools. Collect customerdata to calculate complex formulas for tracking metrics, monitor customer health scores, and resolve support tickets while continuously trying to improve retention and expansion.
What if you could boost revenue without having to invest a small fortune in new customer acquisition? While it may sound too good to be true, the reality is that you can achieve this by implementing an effective customer expansion strategy. What is a customer expansion strategy? How to calculate customer expansion revenue?
This whitepaper discusses how automated business monitoring solutions like Yellowfin Signals revolutionize the way users discover critical and relevant insights from their data. Download to learn: 5 business benefits of automated data discovery with ABM. The evolution of dashboards to automated business monitoring.
I’m going to take a wild guess and assume that you already understand the importance of mobile in-app feedback tools. You might already have a Voice of the Customer (VoC) program in place that you’re looking to improve, or perhaps you’re just trying to get started. Now, more than ever, your customers want to be heard.
It’s what you do with the behavior data your app collects. And by behavior data, I dont mean installs (thats the easy part). I mean what happens after the download: how users navigate, what features they engage with, and where they drop off. Why track in-app user behavior? Whereas a power user is active daily.
Which product feedback software should you choose for your SaaS? In this round-up, I cover 21 of the best product feedback software solutions. In this round-up, I cover 21 of the best product feedback software solutions. The choice is tough because there’s no single tool that covers all use cases. Free trial?
Pro Tip: Pair your quick wins with data. A dashboard showing metrics like feature adoption or user engagement amplifies your credibility. Address Pain Points Proactively: Regularly ask for feedback to show you value their input and are ready to adjust course. It shows youre thoughtful, analytical, and focused on results.
Speaker: Dean Yao, Director of Marketing at Jinfonet
They also want to provide what their users ask for: reporting and analytics from within the context of the applications they are already using. Empower users with better data presentation and exploration for deeper insights into their data. How reports and dashboards make your products stickier.
You get something that truly works for you, and we get to connect with people who value what we offer and have the potential to become power users (and sources of sustainable revenue!). Trying to bring in as many users as possible, only to see most of them lose interest before their free trial is even over. The alternative?
While “use data to drive decision-making” sounds obvious, there’s a HUGE gap between saying it and doing it well. Product analytics refers to the process of gathering and analyzing data on how users interact with a product. Improves product-market fit through actionable insights.
A key ingredient to build a better product is customerfeedback. There are various ways to collect customerfeedback that include customer surveys through sales executives, feedback forms, focused interviews, etc. How to gather relevant data??—?This This is a topic for another article.
Today, businesses are having more conversations with customers than ever before, thanks to the rise of business messengers. And it’s certainly easier than ever for a customer to start a conversation and get support. So businesses should know more about their customers than ever before, right?
You know your product collects tons of data. Data visualization tools help turn your messy spreadsheets into clear, interactive insights. The best ones dont even need SQL or data science skills. Because product analytics should be easy and accessible for everyone, not just data experts.
They track 47 different key performance indicators (KPIs) in their mobile analytics platform , spend hours debating dashboard numbers, yet can’t predict which users will churn next week The problem here isn’t a lack of data. 86% of leaders agree that this data overwhelm leads to less confidence in decisions.
Now, more than ever, your customers want to be heard. They’re itching to give you feedback. To help you with this, we compiled a list of the top mobile in-app feedback tools of 2021. Mobile in-app feedback tools & solutions. mParticle is the customerdata platform for brands leading the CX revolution.
What happens when you build a product or service around what you think potential customers want, only for them to buy something else? For starters, it shows you dont know your customers well enough. But worse than that, it leads to lower revenue, failed products, and plummeting customer loyalty. The short answer: yes.
One look at your mobile app analytics dashboard, and you just want to shut your eyes and scream in frustration. You aim to extract meaningful insights to improve app performance and user engagement. Instead, choose actionable metrics that reflect your apps unique value, user behaviours , and business model.
Reveal Embedded Analytics We know how difficult it is to create dashboards, especially for web applications. However, running business operations or targeted campaigns without insights into their effectiveness is not an option. Thats what dashboards are for. They track everything from user behavior to system performance.
Customer Retention Rate (CRR) is a key business performance metric that measures the percentage of customers a company retains over a givenperiod. CRR formula, reference values andexample Customer Retention Rateformula Number of customers at the end of the period : Total number of customers at the end of the measuredperiod.
The longer they work on their idea, the more invested they become, increasing the likelihood they miss the negative feedback altogether. A lot of these potential users were product managers, which got Kranthi interested in the field of product management and potential use cases for a tool like this. It’s a vicious cycle.
A high bounce rate might seem like lost interest, but what if users left because they couldnt find what they needed? Quantitative data alone doesn’t reveal intent, only outcomes. Thats why you need user session analysis. This reduces support costs, improves customer satisfaction, and accelerates the iteration cycle.
Are you wondering how the new Userpilot custom analytics dashboards can help you drive product growth? In this article, you will learn about the main benefits of custom product analytics dashboards and how to create them in Userpilot. Userpilot is a robust analytics tool so you can use its own data.
Last month we turned our attention to data – unleashing new features that help you improve how you collect, access, and use first-party data to influence your product and scale your business. Surveys: Now even more insightful and engaging. Gain deeper insights with advanced reporting for Surveys. Satmetrix Systems, Inc.,
Customerinsights enable SaaS teams to understand them better and build products that satisfy their genuine needs. From the article, you’ll learn about different kinds of customerinsights (from product analytics and only) and the benefits of gathering them. Let’s dive right in! Book the demo to find out how!
Can you imagine what the ideal SaaS customer onboarding process looks like? When done well, it can be the difference between a user becoming a loyal customer or churning after the first week. The SaaS user onboarding process is the guidance that users go through from the moment they sign up for a software product.
Chatbots (ChatGPT, Claude) Best for: Prototypes that are just one page and don’t have complex design requirements, like calculators, flip cards, or data visualizations Chatbots are capable of writing code in response to a question or prompt. file conversion, job applicant tracking) and data-driven applications (e.g.
Tracking user behavior analytics in mobile apps is a whole different challenge compared to the web. Without a global DOM or easy auto-capture tools, tracking mobile app user behavior takes more planning. And the behavioral data you do collect depends on what you choose to track and how you track it. Mobile analytics ?
This leads to errors like sending a product update notification at 1 AM or showing the wrong message to the wrong user segment. 78% of users churn in the first week after installation when brands dont have a clear engagement strategy based on regular push notifications. One swipe, and your user is back in the app.
Soon after, a backlash followed, and users flooded social media with complaints. When users interact more, it may seem like a win. However, without qualitative feedback and behavioral insights, teams risk misreading signals, leading to frustration and churn. Userfeedback is valuable , but without data, its just opinions.
How Rumi Cosmetiques Boosted User Experience and Conversion Rates in eCommerce: A Case Study for Marketers andManagers Discover how Rumi Cosmetiques achieved a 75% increase in cart adds and doubled conversion rates by enhancing user experience and conversion rate in eCommerce. Ready to uncover their secrets? Keepreading!
Multiple industries are suddenly forced to move operations online, and support teams are at the forefront of this transformation – battling every day to deliver excellent, fast customer service, while facing an unprecedented volume of enquiries and issues. Sophisticated reporting for valuable insights. Handling complex queries.
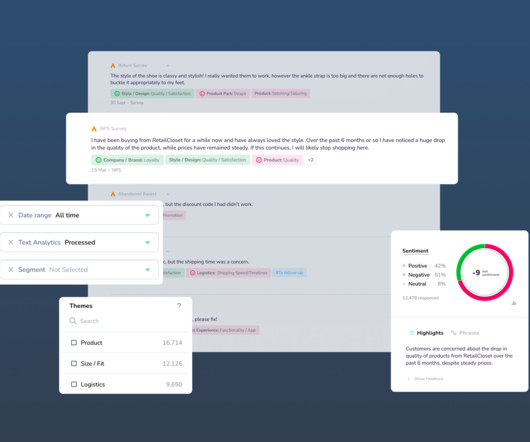
Today, we launched Alchemer Pulse : the only AI-driven text analysis solution specifically built for customer experience and feedback programs. Pulse gets you to the heart of how your customers really think and feel, and instantly turns overwhelming text feedback into signals you can act on.
We organize all of the trending information in your field so you don't have to. Join 96,000+ users and stay up to date on the latest articles your peers are reading.
You know about us, now we want to get to know you!
Let's personalize your content
Let's get even more personalized
We recognize your account from another site in our network, please click 'Send Email' below to continue with verifying your account and setting a password.


Let's personalize your content