This site uses cookies to improve your experience. To help us insure we adhere to various privacy regulations, please select your country/region of residence. If you do not select a country, we will assume you are from the United States. Select your Cookie Settings or view our Privacy Policy and Terms of Use.
Cookie Settings
Cookies and similar technologies are used on this website for proper function of the website, for tracking performance analytics and for marketing purposes. We and some of our third-party providers may use cookie data for various purposes. Please review the cookie settings below and choose your preference.
Used for the proper function of the website
Used for monitoring website traffic and interactions
Cookie Settings
Cookies and similar technologies are used on this website for proper function of the website, for tracking performance analytics and for marketing purposes. We and some of our third-party providers may use cookie data for various purposes. Please review the cookie settings below and choose your preference.
Strictly Necessary: Used for the proper function of the website
Performance/Analytics: Used for monitoring website traffic and interactions
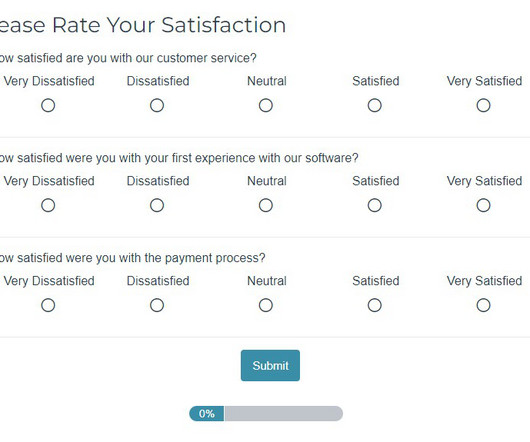
Introduction to customersatisfactionsurveysCustomersatisfactionsurveys are vital tools for understanding what customers think, feel, and experience. Surveys provide a range of insights, from quick feedback after a purchase to in-depth assessments of brand loyalty.
Think of Net Promoter Score (NPS) software as a tool to measure your customers’ feelings about your product, and categorize them based on their level of loyalty (promoters, neutrals, and detractors). The great advantage of these tools is that they streamline the creation, distribution, and analysis of NPS surveys.
Without effective UX analytics that goes beyond collecting data, you’re losing valuable customers. Unfortunately, the research backs this up, with a staggering 90% of usersreporting that they stopped using an app due to poor performance. It covers key topics, such as: Defining UX analytics.
Let’s review everything your customer success team has to do in the absence of any customer success tools. Collect customerdata to calculate complex formulas for tracking metrics, monitor customer health scores, and resolve support tickets while continuously trying to improve retention and expansion.
Most product teams get mobile app analytics wrong. They track 47 different key performance indicators (KPIs) in their mobile analytics platform , spend hours debating dashboard numbers, yet can’t predict which users will churn next week The problem here isn’t a lack of data.
According to the American CustomerSatisfaction Index , with an ACSI score of 78.0, overall customersatisfaction in America was the highest it has ever been in Q1 2024. However, while some companies have managed to improve their customersatisfaction levels and benefit from it, many have not.
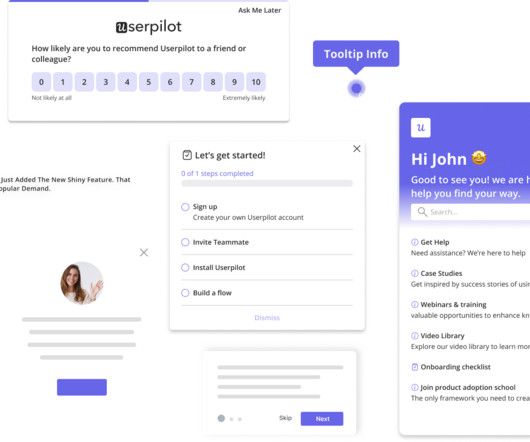
You see, although we work hard to make Userpilot the best product adoption tool on the market, we know it isnt the perfect fit for every business. You get something that truly works for you, and we get to connect with people who value what we offer and have the potential to become power users (and sources of sustainable revenue!).
Drawing from his 20+ years of technology experience and extensive research, Nishant shared insights about how these activities vary across different organizational contexts – from startups to enterprises, B2B to B2C, and Agile to Waterfall environments.
What tools do you use? How do you manage all of that data? We’ve compiled a list of the best tools for mobile in-app feedback —from the technical, back-end side to A/B testing to analyzing VOC (voice of customer). In other words, these in-app visualanalytics track touch gestures. Where do you start?
What is a customer expansion strategy? A customer expansion strategy is a playbook for increasing the revenue from your existing customers, for example, by selling them additional products and services or encouraging them to upgrade to higher plans. How to calculate customer expansion revenue?
Understanding customer experience (CX) isn’t just a strategy—it’s a superpower. Customer experience metrics illuminate the path to customersatisfaction, loyalty, and ultimately, success as an organization. This applies to product development, marketing strategies, and customerservice enhancements.
You can use tools like Google Analytics to track the average session duration and time on specificpages. Average time on page in Google Analytics. Usersatisfaction score (CSAT). This metric is used to measure how satisfied users are with a product, service, or experience. returning customers).
How AI captures customer needs that human product managers miss Watch on YouTube TLDR In my recent conversation with Carmel Dibner from Applied Marketing Science, we explored how artificial intelligence is transforming Voice of the Customer (VOC) research for product teams. However, these early efforts faced significant limitations.
The choice is tough because there’s no single tool that covers all use cases. What’s worse, you will find multiple tools in each category, making it incredibly difficult to pick the tool that satisfies your needs and offers the best value for money. Which product feedback software should you choose for your SaaS?
How Companies Are Funding User Research in 2025: Insights from the User Interviews Research Budget ReportUser Interviews 2025 Research Budget Report is a crucial resource for understanding how modern organizations are approaching the financial side of user research. Only 17% experienced reductions.
But all too often the way the underlying data is collected makes NPS little more than a vanity metric, easily rigged to give the impression of positive customer sentiment, leading to shallow insights and false assurances. Revamping how we do NPS surveys. Defining which customers to survey.
When users interact more, it may seem like a win. However, without qualitative feedback and behavioral insights, teams risk misreading signals, leading to frustration and churn. Numbers alone can be misleading higher engagement doesnt always mean usersatisfaction. Key differences between data types.
What happens when you build a product or service around what you think potential customers want, only for them to buy something else? For starters, it shows you dont know your customers well enough. But worse than that, it leads to lower revenue, failed products, and plummeting customer loyalty.
Organizations that rely on a single-channel feedback approach may overlook valuable insights. These missing insights are crucial for understanding customer needs and expectations. Without a comprehensive view, businesses risk losing opportunities to improve customersatisfaction and build long-term loyalty.
Are you struggling to make sense of scattered userdata? The right customeranalytics platform helps you uncover exactly how customers interact with your product: so you can spot issues early, optimize user journeys, and drive sustainable growth. Pendo – the best software for product-led insights.
During the third stage, input is analyzed and during the fourth stage, the insight gained from analysis is used to make decisions. Our objective is to understand customer needs and adjusting. . Get Insights. And per customer? CustomerSatisfaction. Do customers feel like they are being heard?
Reveal Embedded AnalyticsData-driven companies have a hidden advantage! Theyve consistently outperformed their counterparts, reporting significantly higher metrics across operational efficiency (81% vs. 58%) , revenue growth (77% vs. 61%), and employee satisfaction (68% vs. 39%). How is this possible?
At Alchemer, we’ve established that NPS surveys dont tell the full story. Surveys, combined with open text analysis, however, hold immense potential for uncovering deeper customerinsights from customer feedback. Use these questions liberally to uncover richer insights.
TL;DR Customer experience software helps you analyze, manage, and improve all facets of your product to boost customersatisfaction. Every customer experience solution focuses on a different aspect of improving customer interactions. Userpilot helps you with customer engagement and data management.
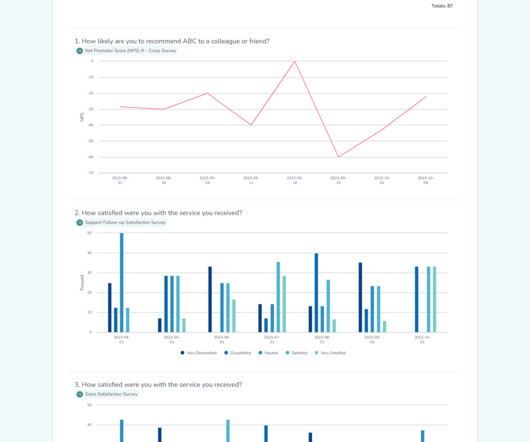
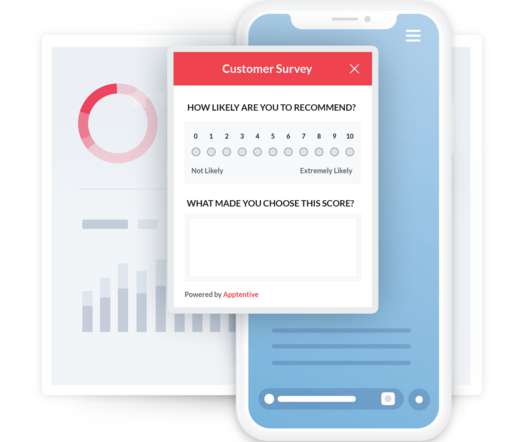
Net Promoter Score ( NPS ) is a metric that aims to quantify customer sentiment based on this survey question: How likely are you to recommend (our product) to a friend or colleague? You see, NPS is mostly a relational metric (which means it’s focused on customer relationships). Then your NPS would be zero.
They also present a valuable opportunity to collect user feedback on a range of topics, from brand sentiment to user experience, using mobile app surveys. Four best practices for successful mobile app surveys In some ways, mobile survey best practices are similar to those for other channels, like email.
By combining questions and reports from different surveys, you can view feedback across touch points, timeframes, and audience segments within a single report view. This allows you to save time while you deliver better data to drive decisions.
Customer intelligence (CI) data and insights are instrumental in product management. They also help create a personalized customer experience and improve product adoption. However, with so many customer intelligence tools available, how do you select the right one? Book a demo now to see it in action.
Quantitative data alone doesn’t reveal intent, only outcomes. Thats why you need user session analysis. By combining contextual insights from session replays , heatmaps, and behavior analytics, user session analysis helps you interpret metrics through the lens of real user journeys.
Understanding how to analyze surveydata doesn’t have to be complicated. With the right survey questions, you can gain insights into what your customers like and dislike about your brand, products, and services. The two main types of surveydata are quantitative data and qualitative data.
If you are a SaaS company, the chances are you’ve come across the term “self-serve analytics” at some point online. Unlike traditional data analysis methods, self-serve analytics equips everyone in your organization to explore data and take the right actions in real time. Choosing a good business intelligence tool.
Well start with an overview and explore how AI can take on tasks such as analyzing userdata and automated prototyping to help professionals connect with users on a humanlevel. Its influence is growing across three key areas: innovative technologies, automation of design tasks, and personalized user experiences.
In today’s competitive landscape, customer experience (CX) stands as a cornerstone of success, particularly in the financial services industry. In our digital world, it has never been easier for customers to switch banks, wealth and investment managers, or financial technologies.
Modern customers expect quick, personal, and effective service. To provide this, you must understand how your customer experience stacks up against these expectations. But with so much data to consider, how can you define the help desk metrics that matter for your team? What are help desk metrics?
With Userpilots mobile solution , you can personalize in-app flows, trigger context-aware push notifications, and capture real-time insights: all without writing a single line of code. To show you how, Ill cover seven strategies that smooth out friction, enhance user engagement, and turn one-off app downloads into returning customers.
Surveying your mobile customers is a great way to find out more about who they are, what drives them back to your app, how they feel about your app, and what they’d like improved. Every customer has unique preferences, tastes, likes, and dislikes. Intuitively, customer individuality makes perfect sense.
Whatfix Mobile is a Digital Adoption Platform (DAP) specifically designed to enhance the experience for users of native Android and iOS apps. Whatfix delivers context-aware guidance that helps users correctly complete sensitive tasks like handling patient documents, uploading payroll data, etc., What is Whatfix for mobile?
Data-driven companies are 58% more likely to hit revenue goals. This shows how important business analytics is for your product. Business analytics gives insights that help you make better decisions to improve your product. This article will show seven examples of business analytics to highlight its positive impact.
Tracking the right user metrics helps you precisely identify issues in the product experience rather than feeling lost in a sea of data. Choosing the wrong KPIs can be more damaging than you think – it drains your teams resources, shifts focus away from real problems, and ultimately, disrupts the customer experience.
Once the user completes verification, they are guided through a short welcome survey that gathers critical information like the user’s role, goals, and company details. The survey also allows for basic customization, such as branding colors. This approach makes sense for a data-driven product like Amplitude.
Mobile surveys are powerful in understanding sentiment, but only if they’re shown at the right place and time within the app, to the right consumer segment. Through mobile, short surveys with specific asks (like feedback on a new feature) are effective and efficient. Why you should use mobile surveys.
Does the thought of quantitative data analysis bring back the horrors of math classes? But conducting quantitative data analysis doesn’t have to be hard with the right tools. Want to learn how to turn raw numbers into actionable insights on how to improve your product? Collecting and cleaning data.
From Raw Data to Clarity — Cleaning, Sorting, and Synthesising Insights Part 4 (of 5) of the UX Research Playbook series Synthesising qualitative data is similar to reaping the harvest after the diligent effort poured into research — it’s the step where hard work blossoms into meaningful insights. Mural , Miro , etc.)
The key is to understand your users and continuously optimize your mobile app for exceptional value. Overview: Mobile app analytics metrics Below is a quick summary of the mobile metrics every PM should be tracking. 1 Engagement DAU/MAU Understand daily and monthly active user engagement and overall app popularity.
We organize all of the trending information in your field so you don't have to. Join 96,000+ users and stay up to date on the latest articles your peers are reading.
You know about us, now we want to get to know you!
Let's personalize your content
Let's get even more personalized
We recognize your account from another site in our network, please click 'Send Email' below to continue with verifying your account and setting a password.


Let's personalize your content