This site uses cookies to improve your experience. To help us insure we adhere to various privacy regulations, please select your country/region of residence. If you do not select a country, we will assume you are from the United States. Select your Cookie Settings or view our Privacy Policy and Terms of Use.
Cookie Settings
Cookies and similar technologies are used on this website for proper function of the website, for tracking performance analytics and for marketing purposes. We and some of our third-party providers may use cookie data for various purposes. Please review the cookie settings below and choose your preference.
Used for the proper function of the website
Used for monitoring website traffic and interactions
Cookie Settings
Cookies and similar technologies are used on this website for proper function of the website, for tracking performance analytics and for marketing purposes. We and some of our third-party providers may use cookie data for various purposes. Please review the cookie settings below and choose your preference.
Strictly Necessary: Used for the proper function of the website
Performance/Analytics: Used for monitoring website traffic and interactions
Introduction to customersatisfaction surveys Customersatisfaction surveys are vital tools for understanding what customers think, feel, and experience. This information empowers teams across your company to make informed decisions based on customer experiences and perceptions.
Aarti : Showcase measurable results like improved customersatisfaction and achieved business goals. Tom : Tailor your messaging to address the specific concerns of each stakeholder group. Q: How do you communicate product management’s impact on business outcomes?
This led to the creation of “product success teams” – cross-functional groups that included leaders from various departments working together to ensure product success in the market. Kimberly has also led sales, partner programs, managed services and customer success over the course of her career.
.” This form of nurturing yields certain advantages: Consistent customer experience : Automation allows for tailored experiences based on individual customer data. It also ensures that the process is standardized for all customers. Then, launch a pilot test with a small group of customers to identify areas for improvement.
In addition to NPS, you can create other types of surveys from scratch or choose from various templates, covering customersatisfaction ( CSAT ), feedback forms, and more. Use AI-driven predictive analytics to forecast customer behaviors based on their feedback. Customize surveys to reflect your brand’s look and feel.
This would then allow other groups at eBay to start using this information to create new buyer and seller experiences. Have you ever seen customersatisfaction or felt market readiness? With that focus in mind, we started rolling. We were super strict on delivery. Thinking about outcomes, though, is much trickier.
Uncover why the needs exist : Even when using methods like user feedback widgets and focus groups, the aim is to learn how users use your product. These methods can be used to dig deeper into the user’s brain. For example, are new users exploring core functions or just the basics?
Through dynamic content delivery , AI can tailor what each user sees based on their past behavior, preferences, and real-time interactions. This makes the experience feel more relevant and engaging, increasing the likelihood of usersatisfaction. Next, ensure diverse and representative training data for AI models.
A higher stickiness ratio suggests your product is a regular part of users routines. However, a low stickiness ratio may signal issues with usersatisfaction, feature relevance, or overall value, prompting further investigation. User stickiness formula. Passives (7-8): Neutral users who are satisfied but not enthusiastic.
Faced with declining usersatisfaction due to sluggish response times on their record page, HubSpot conducted extensive usability testing. This not only improved usersatisfaction but also contributed to a 33% increase in revenue growth, showcasing the ROI of strategic UX enhancements.
Include any bug fixes Inform users about any issues that have been resolved without overwhelming them with technical details. For example, if a bug causes the app to crash when uploading large files, simply communicating the problem and resolution can improve usersatisfaction. And all this with no code needed.
As companies mature, so does their understanding of how strategic research drives product innovation and customersatisfaction. Meanwhile, for enterprises with deeper pockets, investing over $500K annually in user research has become a competitive advantage particularly in fast-moving industries like fintech, SaaS, or e-commerce.
And now, a group of people see it as a vanity metric rather than a valuable indicator of customer sentiment. It only measures promoters, which are loyal customers that are so infatuated with your product that they cant help but talk about it. However, so many companies use it to measure satisfaction.
Analytics reports like paths, funnels, and cohort tables for visualizing user behavior data. Session replays to see how users navigate your product. 15+ survey templates (NPS, CES, usersatisfaction surveys, etc.) for collecting user sentiment data. NPS response tagging for analyzing qualitative feedback.
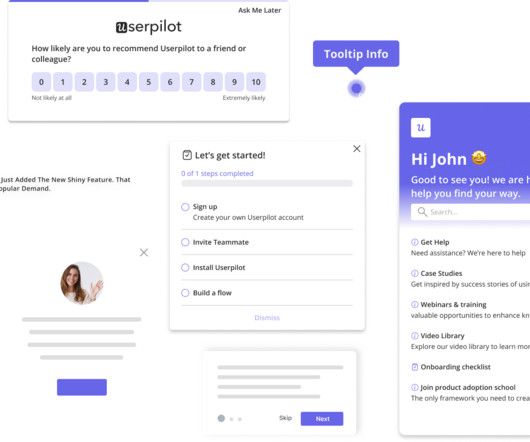
When new users sign up, a visible progress bar tracks their completion of essential setup tasks. It takes onboarding gamification a step further by grouping tasks into categories. Milestone celebrations Another efficient way to engage users is by gamifying milestone celebrations to acknowledge their progress and efforts.
Here are four high-friction moments where alignment tends to crack — and how product leaders can turn resistance into support by addressing what each group truly values. Close the loop by sharing back how their insights translated into action, using clear metrics to show impact on customersatisfaction.
Over time, Pinterest enhanced this system with graph neural networks like PinSage, which groups similar Pins to improve the discovery of adjacent interests you didnt explicitly search for but would likelyenjoy. Amazon demonstrates how personalization can directly drive revenue and repeat purchases, significantly impacting business outcomes.
When it comes to collecting customer feedback, it offers a survey template library, which includes all industry-standard surveys, like NPS and customersatisfaction surveys. The survey settings allow you to send it to a specific usergroup and set it to appear at regular intervals, for example, every 3-4 months.
Get a Demo Understanding your users goes far beyond knowing their age, role, or company size. Demographic segmentation is a starting point, but it’s customer behavior that reveals true intent. Behavioral segmentation allows you to groupusers based on what they actually do. Create a new user segment with Userpilot.
1 Engagement DAU/MAU Understand daily and monthly active user engagement and overall app popularity. 2 Engagement Feature adoption Gauge user interest in new features and optimize feature development. 3 Engagement Average user session length Measure user interactions and identify areas for improved content or flow.
BMC components Customer segments: Different groups of people or organizations that your business aims to serve. Value propositions : The products or services that create value for each customer segment. Channels: How your company communicates with and reaches its customer segments to deliver the value proposition.
Without intuitive, embedded self-service capabilities, organizations experience bottlenecks that impede scaling analytics and limit user empowerment. They affect product adoption, customersatisfaction, and an organization’s ability to operate with agility. These limitations extend beyond technical inconvenience.
However, without a solid foundation in user research, this framework may be limited to a set of quantitative metrics that fail to adequately reveal the why behind observed behaviors. Tools like click tracking and funnel analysis help pinpoint where users encounter difficulties during onboarding.
In-app guides are part of a self-serve onboarding strategy; they reduce support and customer success costs while increasing customersatisfaction. Users get access to help just when they need it. Targeting and segmentation: Appcues provides basic segmentation capabilities for targeting specific usergroups.
Group findings into themes and sub-themes Cluster related observations, typically piggy-backing notes with the same sentiment/idea vertically. This approach helps identify overlooked observations and builds a shared understanding of the findings within the group.
In this post, youâll learn how to tailor customer insights for three key groups: product managers, engineers, and executives. Youâll see how to present user testing results in a way that helps each team take action. Why Framing Customer Insights Improves Decision Making Storytelling with data builds clarity and empathy.
During this phase, I track metrics like task completion rate, error rate, and usersatisfaction score. For example: Card sorting: I use card sorting when I need to understand how users mentally organize content or features. Then, choose the test method based on the data you need. How to test mobile usability?
HubSpot: Group Product Manager, Growth Onboarding The HubSpot Product team is passionate about building tools that help small and medium-sized businesses market, sell, serve their customers, and ultimately grow better. They have built for more than 200,000 customers in over 100 countries around the world.
The long answer: once you know what your customers want, you reduce the risk of product failure. Instead, you can build products with a better product-market fit that address all user demands and improve customersatisfaction. For example, 71% of customers now expect far more personalization than before.
Cohort analysis: Userpilots cohort analysis groupsusers by criteria like sign-up date, feature usage, or engagement levels. It lets you track behavior over time, compare how different groups evolve, and assess the long-term impact of product updates or campaigns. Use Userpilot to analyze promoters paths during onboarding.
Resource centers (in-app): are embedded in your product to deliver contextual help when users need it. It typically includes features like interactive walkthroughs that help UX designers and marketing teams improve customersatisfaction, drive feature adoption, and reduce time spent on routine customer requests.
This reduces support costs, improves customersatisfaction, and accelerates the iteration cycle. How user session analysis can turn observations into improvements Understanding user behavior isn’t primarily a technical challenge. By common patterns and outliers: Group sessions by task completion paths and timing.
Its all-in-one platform supports smooth communication between teams and users. Sleekplan is ideal for teams looking to improve user experience by integrating feedback and tracking customersatisfaction. How to Structure a Changelog A well-organized changelog helps users quickly grasp what’s new.
Use the data to set conditions to make segments: I use Userpilots segmentation feature to groupusers based on several factors, including demographic and psychographic ones. User persona example. Step 2: Identify interaction touchpoints You cant see where users drop off if you dont know the exact screens they hit in sequence.
User engagement measures how actively users interact with features but doesnt indicate whether they return. User retention tracks how many users stay over time but doesnt show how frequently they use the product. Customersatisfaction reflects usersatisfaction, but even these users may not engage frequently.
Personalization: AI tailors products to individual preferences, enhancing usersatisfaction. How to getstarted: Join a local or online group: Explore Reddits r/UserExperience. Generative Design: AI creates multiple design options based on set parameters, expanding creative possibilities.
A dedicated release notes page becomes a hub of discovery where users can uncover new features, celebrate improvements, and appreciate the progress shaped by their feedback. Group updates by typenew features, bug fixes, or improvementsso users can quickly find what matters to them. The Secret? Who Should Write Release Notes?
Adoption Meter to track user moods and understand how users feel about your product or feature. NPS surveys for measuring usersatisfaction and gathering insights for improvement. Decent targeting options using user segmentation and behavioral triggers.
Social affirmationwhether through peer comparisons, chatbot suggestions or advisor tipsreinforces user success and builds trust in thesystem. Building DopamineMoments Community Benchmarks: Anonymous comparisonssuch as Youve saved more than 75% of people in your age group!create create pride and a sense of achievement.
Foster Relationships and Peer-to-Peer Engagement Communities are fertile ground for cultivating even more super users who can act as advocates and champions for your business. You can also create usergroups based on industry, geography, role, interests, or other attributes, helping develop a sense of belonging among customers.
out of 5 stars Pricing: Growth plan at $799/month Supported devices: Web for the time being and mobile coming in 2025 Userpilot is a product growth platform that helps companies increase adoption, usersatisfaction, and retention. Userpilot Best for: Mid-size and enterprise SaaS businesses G2 rating: 4.6
Average content (articles, soundscapes, or programs) consumption per user. Armed with these numbers, you can proceed to create a targeted engagement strategy that fuels business success and enhances usersatisfaction. How do app users interact with it from the moment they download it and beyond?
These features help drive feature adoption, retention, and usersatisfaction, making Userpilot ideal for customer-facing apps. Advanced analytics and segmentation Every usergroup is unique and has different goals for your app. Create mobile slideouts and carousels with Userpilot.
This will give you a general overview of your app’s health and serve as an immediate indicator of usersatisfaction and retention. To calculate your app churn rate, divide the number of customers lost in a specific period by the total number of customers at the start of the period. Come back to the app!”,
We organize all of the trending information in your field so you don't have to. Join 96,000+ users and stay up to date on the latest articles your peers are reading.
You know about us, now we want to get to know you!
Let's personalize your content
Let's get even more personalized
We recognize your account from another site in our network, please click 'Send Email' below to continue with verifying your account and setting a password.


Let's personalize your content