This site uses cookies to improve your experience. To help us insure we adhere to various privacy regulations, please select your country/region of residence. If you do not select a country, we will assume you are from the United States. Select your Cookie Settings or view our Privacy Policy and Terms of Use.
Cookie Settings
Cookies and similar technologies are used on this website for proper function of the website, for tracking performance analytics and for marketing purposes. We and some of our third-party providers may use cookie data for various purposes. Please review the cookie settings below and choose your preference.
Used for the proper function of the website
Used for monitoring website traffic and interactions
Cookie Settings
Cookies and similar technologies are used on this website for proper function of the website, for tracking performance analytics and for marketing purposes. We and some of our third-party providers may use cookie data for various purposes. Please review the cookie settings below and choose your preference.
Strictly Necessary: Used for the proper function of the website
Performance/Analytics: Used for monitoring website traffic and interactions
Without effective UX analytics that goes beyond collecting data, you’re losing valuable customers. Unfortunately, the research backs this up, with a staggering 90% of users reporting that they stopped using an app due to poor performance. It covers key topics, such as: Defining UX analytics. What is UX analytics?
Think of Net Promoter Score (NPS) software as a tool to measure your customers’ feelings about your product, and categorize them based on their level of loyalty (promoters, neutrals, and detractors). The great advantage of these tools is that they streamline the creation, distribution, and analysis of NPS surveys.
You can gather all the user feedback or behavioral data you want or even generate tons of Google Analyticsreports. Despite all these efforts, you’re probably still not acting on product analytics correctly. Why actionable product analytics are important. This causes siloed data and integration issues.
Well, it’s not quite that simple – despite the influx of customer conversations, it can be hard to derive meaningful insights from all that data. Identifying the right insights is key to operating at scale while keeping your customer experience personal, but it’s a huge challenge to find the signal in the noise.
Speaker: Daniel O'Sullivan, Product Designer, nCino and Jeff Hudock, Senior Product Manager, nCino
We’ve all seen the increasing industry trend of artificial intelligence and big dataanalytics. In a world of information overload, it's more important than ever to have a dashboard that provides data that's not only interesting but actually relevant and timely. Dashboard design do’s and don’ts.
In the retail industry, customer feedback is your early warning system, your innovation engine, and your most honest performance review. Heres how to take insights from customer feedback and turn them into results. The following post references our new e-guide, The Retail Industrys Blueprint to Leveling Up CX . Level it up!
Reveal Embedded Analytics For product owners, leveraging data is not just an advantageits a necessity. Product analytics empowers you to understand gaps in your offering and how users engage with your product. Both embedded analytics and product analytics are designed to help product owners in diverse ways.
Case Study: Improving Data-Driven Decision Making for CSR Leadership Civian is a data-driven platform designed to help businesses measure, optimize, and showcase the social and economic impact of their investments in communities. Feature Engagement Users most frequently gravitated toward the map to explore and compare data.
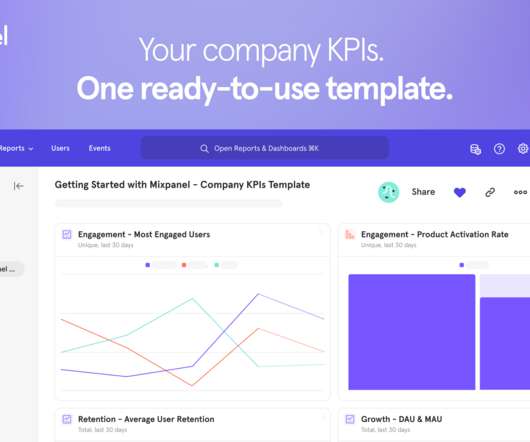
Learn about the importance of mobile app KPI dashboards and copy dashboards from real mobile app product managers, engineers and designers. A key performance indicator (KPI) dashboard is a visual representation of data that quantifies how well a team is performing towards its goals.
To take the guesswork out of measuring the right metrics, today we released the Company KPIs Dashboard template—nine out-of-the-box, fully customizable reports that make it easy for anyone to measure engagement, retention, and growth metrics. Other times, you need data to be accessible ASAP. Less effort, more value—faster!
A customer expansion strategy is a playbook for increasing the revenue from your existing customers, for example, by selling them additional products and services or encouraging them to upgrade to higher plans. As your team grows and you hire new people or other departments adopt the tool, the number of seats needed increases.
Visualdata surrounds us – colorful charts on weather reports, infographics on the web and in social media articles, map charts in presentations, etc. To help you get started with datavisualization, this article explores various visualization methods and their use cases. Funnel charts. Pie charts.
If you’re shopping around for a mobile app analytics platform before biting the bullet with Fullstory, you’ve landed in the right place. FullStory is a robust web and analyticstool but there are platforms out there that may specialize in one of the features you want. Best for AI-powered future outcomes predictions.
A customer sentiment dashboard is a great way to visualize customer feedback and see what users love (or hate) about your product. But how do you collect the right data for your analysis? This article shows you a step-by-step process and some of the best tools to use. Comparison with internal and industry benchmarks.
I’m going to take a wild guess and assume that you already understand the importance of mobile in-app feedback tools. You also might be reading this post thinking: “Who’s adding new tools to their tech stack right now?” Do you have the right tools to capture that voice? Mobile in-app feedback tools & solutions.
Reveal Embedded AnalyticsData-driven companies have a hidden advantage! Theyve consistently outperformed their counterparts, reporting significantly higher metrics across operational efficiency (81% vs. 58%) , revenue growth (77% vs. 61%), and employee satisfaction (68% vs. 39%). How is this possible?
Are you struggling to make sense of scattered user data? The right customer analytics platform helps you uncover exactly how customers interact with your product: so you can spot issues early, optimize user journeys, and drive sustainable growth. Choose the best fit for your needs and transform data into actionable strategies.
What happens when you build a product or service around what you think potential customers want, only for them to buy something else? It could include conducting user interviews and surveys, analyzing product usage data, and tracking customer feedback , to name a few. For starters, it shows you dont know your customers well enough.
Reveal Embedded Analytics Embedded analytics platforms have gained popularity as businesses seek to leverage data for decision-making and gain a competitive edge. One of these features you should look for is dashboard linking. What Is Dashboard Linking? However, not all solutions are the same.
Reveal Embedded Analytics Embedded analytics platforms have gained popularity as businesses seek to leverage data for decision-making and gain a competitive edge. One of these features you should look for is dashboard linking. What Is Dashboard Linking? However, not all solutions are the same.
If you are a SaaS company, the chances are you’ve come across the term “self-serve analytics” at some point online. Unlike traditional data analysis methods, self-serve analytics equips everyone in your organization to explore data and take the right actions in real time. Choosing a good business intelligence tool.
Nearly 60% of mobile teams still rely on self-hosted push tools. They trade short-term savings for long-term pain: no analytics, poor timing control, and zero personalization. If you want to build a push strategy that improves over time, you need proper analytics, A/B testing , and behavioral insights from day one.
In a fast-paced industry like SaaS, leveraging business analytics effectively can be the key to staying competitive and driving product growth. Business analytics offers invaluable insights that help SaaS companies optimize operations, enhance customer experiences, and make data-driven decisions.
The choice is tough because there’s no single tool that covers all use cases. What’s worse, you will find multiple tools in each category, making it incredibly difficult to pick the tool that satisfies your needs and offers the best value for money. Which product feedback software should you choose for your SaaS?
In 2006, British mathematician Clive Humby made the infamous statement: Data is the new oil. Like oil, raw data needs to be refined, processed and turned into something useful because its value lies in its potential. Unfortunately, most people have yet to understand what it truly means to use data. moment that makes users stick.
Gaming data is one of the most valuable sources of information out there. . gamers’ weekly leisure time going to playing games as of 2018 — companies are sitting on treasure troves of insight. You need an analytics solution and data strategy that can help make that information useful. . What Is Gaming Analytics?
By analyzing user behavior patterns and uncovering valuable insights, behavior analyticstools enable businesses to design strategies that drive retention and business growth. Discover the cutting-edge of behavioral analyticstools! There are different types of behavioral analyticstools used in SaaS.
Reveal Embedded Analytics We live in an era where data shapes decisions across industries. While datavisualizations have become essential, not all standard visualizations cater to specialized reporting needs.
Reference values CRR varies widely across industries due to differences in customer expectations about business. Here are some general reference values for CRR for different industries: Ecommerce: 25%40%. high-value customers or frequent purchasers), you can reveal actionable insights about this group of customers. purchases).
Customer intelligence (CI) data and insights are instrumental in product management. However, with so many customer intelligence tools available, how do you select the right one? In this article, we’ll take you through a list of the top customer intelligence tools. Book a demo now to see it in action.
Unlike traditional mobile web tools, Whatfix focuses exclusively on native mobile environments, allowing enterprises to create deeply integrated, in-app experiences that streamline user onboarding , feature adoption, and contextual in-app training. However, advanced behavior targeting requires a separate analytics integration.
You can get the answers you need simply from product management analyticstools. To help you know which tool to use, this article will cover the ten best product analyticstools. TL;DR Product analyticstools analyze user interaction, preferences, and engagement with a product.
Multiple industries are suddenly forced to move operations online, and support teams are at the forefront of this transformation – battling every day to deliver excellent, fast customer service, while facing an unprecedented volume of enquiries and issues. Sophisticated reporting for valuable insights.
As you’re researching customer analytics platforms, you’ve probably noticed how hard it is to find reliable information on the available solutions. TL;DR Customer analytics platforms are specialized tools that allow you to collect and analyze data. Starts with Einsten Predictions’ $75/month billed annually.)
Other gamification elements include: Rewards Badges Creativity tools Pressure Progress bars Challenges Explore more gamification examples. For example, can you host webinars to educate users about product updates and offer industryinsights? Frequency of reported issue. No guesswork, just data. The result?
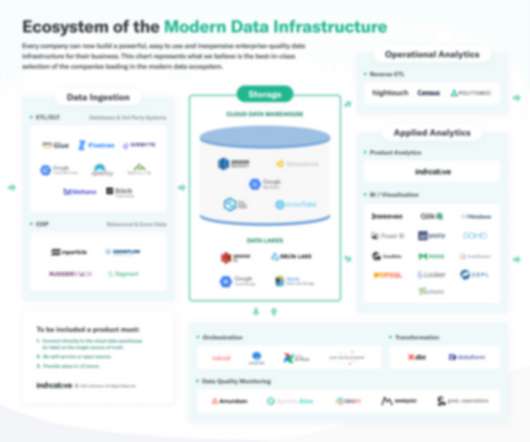
A simplified look at the current data landscape shows that an architecture where companies own and control their own data—where the data warehouse is the central hub connecting to all other tools and a gravity well for all business data—is emerging. The Traditional Approach to Data Architecture.
The “shiny penny” approach (focus all your attention on the hottest tools in the market) or “head in the sand” approach (fall victim to analysis paralysis and avoid choosing any tools) are no longer viable. But here’s the thing: a tool is not a strategy. The anatomy of a marketing tech stack [with recommended tools].
But figuring out which sales tools you should buy and invest in – let alone what each tool even does – can be a daunting task. This is especially true when you consider the seemingly endless list of sales tools to choose from. Before we begin: how to choose your sales tools. Better tools, not more tools.
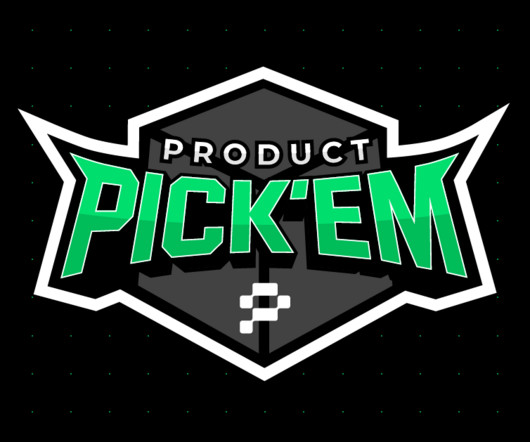
Welcome to Product PickEm 2025 , where the best emerging product tool startups go head-to-head in a bracket-style competition, and YOU decide which ones rise to the top via our LinkedIn polls on the Productside page. Each round, the lowest-scoring tools get eliminated, and the best move forward. Forget the hype. Four winners.
Want to conduct customer journey visualization but not sure what’s the best way to do it? This article shows you a step-by-step process for collecting customer data and creating easy-to-understand visual maps. Understanding these steps and the motivations behind them enables you to support customers in succeeding with your tool.
Example: Imagine you’re designing a new dashboard for a fintech app. Example: For our dashboard, we might ask, “How might we create a dashboard that helps analysts quickly spot trends and take action?” With AI tools like ChatGPT making waves, it’s natural to wonder how they fit into the sprint process.
Looking for a Google Analytics alternative that offers better customization, improved product analytics , and more data accuracy? TL;DR Google Analytics is an analytics platform offered by Google that helps businesses track website or app performance. Limited data control and ownership.
Welcome to Product PickEm 2025 , the ultimate startup showdown where the best emerging product tools compete in a bracket-style competition. You get to vote for the tools you believe in and help crown the final winner via our LinkedIn polls on the Productside page. Metabase serves up datainsights without burying you in code.
Instead, we must go back to the age-old mantra that a picture is worth a thousand words and provide a visual representation of what the future could look like if we are successful. Design: Customer Discovery Insights. Whenever you are surprised it means you've collected a valuable insight. Design: Product Roadmap.
We organize all of the trending information in your field so you don't have to. Join 96,000+ users and stay up to date on the latest articles your peers are reading.
You know about us, now we want to get to know you!
Let's personalize your content
Let's get even more personalized
We recognize your account from another site in our network, please click 'Send Email' below to continue with verifying your account and setting a password.


Let's personalize your content