This site uses cookies to improve your experience. To help us insure we adhere to various privacy regulations, please select your country/region of residence. If you do not select a country, we will assume you are from the United States. Select your Cookie Settings or view our Privacy Policy and Terms of Use.
Cookie Settings
Cookies and similar technologies are used on this website for proper function of the website, for tracking performance analytics and for marketing purposes. We and some of our third-party providers may use cookie data for various purposes. Please review the cookie settings below and choose your preference.
Used for the proper function of the website
Used for monitoring website traffic and interactions
Cookie Settings
Cookies and similar technologies are used on this website for proper function of the website, for tracking performance analytics and for marketing purposes. We and some of our third-party providers may use cookie data for various purposes. Please review the cookie settings below and choose your preference.
Strictly Necessary: Used for the proper function of the website
Performance/Analytics: Used for monitoring website traffic and interactions
While “use data to drive decision-making” sounds obvious, there’s a HUGE gap between saying it and doing it well. So, how do you get started with product analytics ? In this article, we’ll talk about: What product analytics is and why you need a solid strategy. What is product analytics?
You can gather all the user feedback or behavioral data you want or even generate tons of Google Analyticsreports. Despite all these efforts, you’re probably still not acting on product analytics correctly. Why actionable product analytics are important. This causes siloed data and integration issues.
Let’s review everything your customer success team has to do in the absence of any customer success tools. Collect customer data to calculate complex formulas for tracking metrics, monitor customer health scores, and resolve support tickets while continuously trying to improve retention and expansion.
When your company adopts multiple SaaS solutions to drive productivity, you unknowingly create a perfect storm for data fragmentation. Your customer information lives in Salesforce, while your support tickets are in Zendesk, your product usage data in Mixpanel, and your marketing campaigns in HubSpot. Sound familiar?
Think your customers will pay more for datavisualizations in your application? But today, dashboards and visualizations have become table stakes. Discover which features will differentiate your application and maximize the ROI of your embedded analytics. Brought to you by Logi Analytics.
You see, although we work hard to make Userpilot the best product adoption tool on the market, we know it isnt the perfect fit for every business. Robust resource center functionalities for offering self-service help. Custom dashboards to track key metrics at a glance. for collecting user sentiment data.
Well, it’s not quite that simple – despite the influx of customer conversations, it can be hard to derive meaningful insights from all that data. Identifying the right insights is key to operating at scale while keeping your customer experience personal, but it’s a huge challenge to find the signal in the noise.
Reveal Embedded Analytics We know how difficult it is to create dashboards, especially for web applications. However, running business operations or targeted campaigns without insights into their effectiveness is not an option. Thats what dashboards are for. It offers several options when it comes to dashboard libraries.
As you’re researching dashboardreportingtools, you’ve probably noticed how hard it is to find reliable information on the available solutions. TL;DR Dashboards display critical business data in real-time, streamlining decision-making and focusing on key metrics. Let’s dive in!
Speaker: Miles Robinson, Agile and Management Consultant, Motivational Speaker
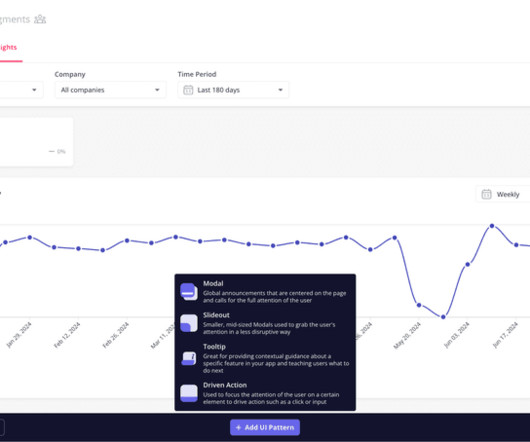
Dashboards and analytics can really set your application apart, but that doesn't mean you can implement them and forget about them. What should be improved, and what do we have the resources to improve? Are they adding value to your product? Do your users benefit from them anymore?
Are you tracking SaaS metrics without knowing how to make the analytics process easier? Analyticsdashboards are visualizationtools that give you an overview of key metrics. This makes it much easier to extract insights from your analysis compared to looking at mere numbers. Book a demo to learn more.
Pro Tip: Pair your quick wins with data. A dashboard showing metrics like feature adoption or user engagement amplifies your credibility. Advanced Tactics: Stakeholder Mapping: Use tools like the Stakeholder Alignment Blueprint (available on jonihoadley.com) to identify key goals and concerns. Click here to download.
A customer expansion strategy is a playbook for increasing the revenue from your existing customers, for example, by selling them additional products and services or encouraging them to upgrade to higher plans. As your team grows and you hire new people or other departments adopt the tool, the number of seats needed increases.
What tools do you use? How do you manage all of that data? We’ve compiled a list of the best tools for mobile in-app feedback —from the technical, back-end side to A/B testing to analyzing VOC (voice of customer). In other words, these in-app visualanalytics track touch gestures. Where do you start? Apptentive.
If you’re shopping around for a mobile app analytics platform before biting the bullet with Fullstory, you’ve landed in the right place. FullStory is a robust web and analyticstool but there are platforms out there that may specialize in one of the features you want. Best for AI-powered future outcomes predictions.
Reveal Embedded AnalyticsData-driven companies have a hidden advantage! Theyve consistently outperformed their counterparts, reporting significantly higher metrics across operational efficiency (81% vs. 58%) , revenue growth (77% vs. 61%), and employee satisfaction (68% vs. 39%). How is this possible?
Are you struggling to make sense of scattered user data? The right customer analytics platform helps you uncover exactly how customers interact with your product: so you can spot issues early, optimize user journeys, and drive sustainable growth. Choose the best fit for your needs and transform data into actionable strategies.
I’m going to take a wild guess and assume that you already understand the importance of mobile in-app feedback tools. You also might be reading this post thinking: “Who’s adding new tools to their tech stack right now?” Do you have the right tools to capture that voice? Mobile in-app feedback tools & solutions.
In a fast-paced industry like SaaS, leveraging business analytics effectively can be the key to staying competitive and driving product growth. Business analytics offers invaluable insights that help SaaS companies optimize operations, enhance customer experiences, and make data-driven decisions.
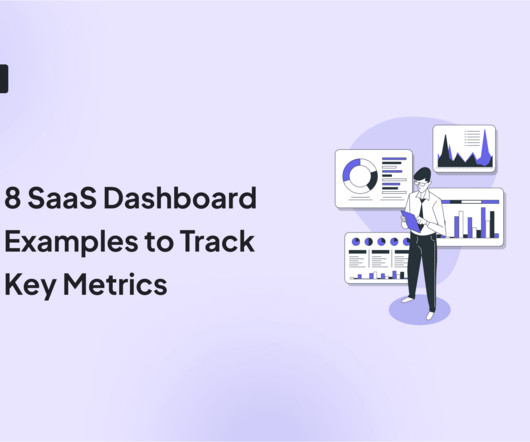
Would you like to learn how to design a SaaS metrics dashboard for your team without any coding? In the article, you will find examples of various SaaS dashboards and learn how to create them with Userpilot analytics. We also explain what metrics you may want to track and how to use the insights they offer.
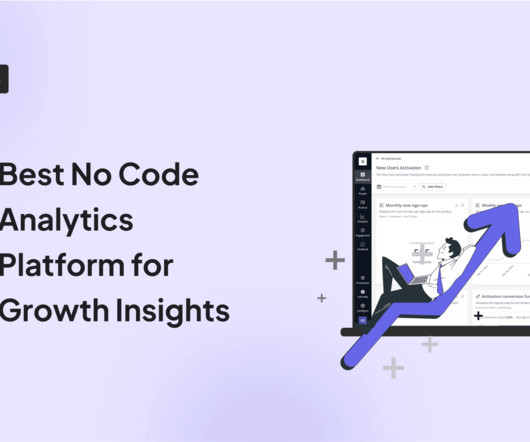
Dataanalytics plays an instrumental role at every step of building a successful product. Whether you’re building your user base or releasing a new feature, the right no-code analytics platform can help you make evidence-based decisions. Many of these tools even come with AI capabilities. Let’s get right to it.
When it comes to product management, you need to look at different SaaS dashboard examples to see what kind of product analytics you can measure, and how. So what are the most important types of dashboards and which ones are the best for you? Ready to transform your data into actionable insights?
To better understand the common challenges organizations face with digital feedback tools, we conducted a comprehensive market research study that revealed several critical pain points. When one tool gathers feedback via email and another through your website, consolidating all that data and customer feedback can be nearly impossible.
This survey can help you deliver tailored content to your audience with different onboarding elements: interactive walkthroughs , resource center , user onboarding checklists, tooltips, and surveys. You can also call it directly from the in-app resource center. You can do this by creating a resource center.
By analyzing user behavior patterns and uncovering valuable insights, behavior analyticstools enable businesses to design strategies that drive retention and business growth. Discover the cutting-edge of behavioral analyticstools! There are different types of behavioral analyticstools used in SaaS.
Customer intelligence (CI) data and insights are instrumental in product management. However, with so many customer intelligence tools available, how do you select the right one? In this article, we’ll take you through a list of the top customer intelligence tools. Book a demo now to see it in action.
Analyticstools offer a competitive advantage for companies investing in prolonged product growth. However, not all companies can invest precious resources in an analyticstool. In reality, some companies are better served using free vs paid analytics platforms. There are different types of analyticstools.
Even more startling, product managers reported spending 45% less time on strategy than theyd like in 2023. A 2022 Product Excellence Report revealed that only 36% of PMs are confident their products and features consistently meet customer expectations. Use this insight to refine your approach. Where did delays occur?
Do you have the right tools to capture that voice? To help you with this, we compiled a list of the top mobile in-app feedback tools of 2021. Incorporating these tools into your customer experience tech stack will drive more engagement, gather high-quality customer feedback, and help inform your product roadmap. Apptentive.
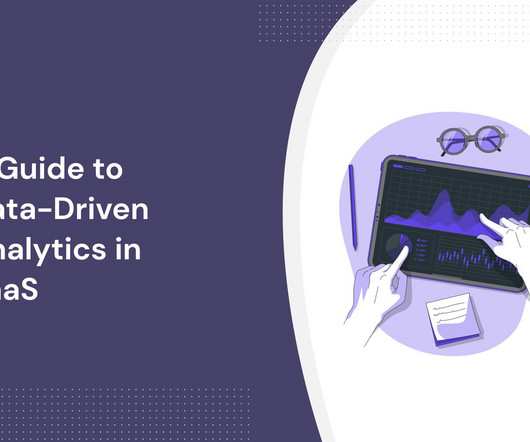
What is data-driven analytics in SaaS? How to conduct user data analysis? What are the best analyticstools for the job? TL;DR Data-driven analytics describes the process of collecting, analyzing , and interpreting customer data to help organizations make better-informed product and strategic business decisions.
Unlike traditional mobile web tools, Whatfix focuses exclusively on native mobile environments, allowing enterprises to create deeply integrated, in-app experiences that streamline user onboarding , feature adoption, and contextual in-app training. However, advanced behavior targeting requires a separate analytics integration.
Explore the secrets of creating a successful Crypto Prediction and Opinion Platform, and provide users with insights to help them navigate the cryptocurrency market wisely. Crypto prediction platforms provide valuable insights into the volatile world of cryptocurrency markets, aiding users in making informed decisions.
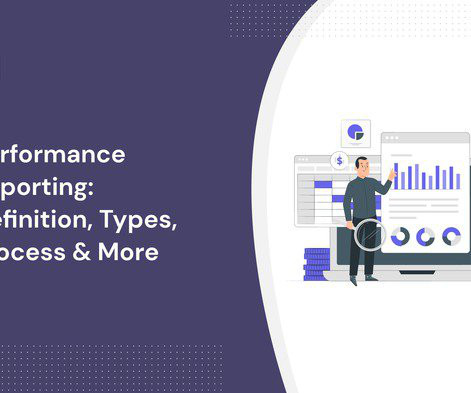
Performance reporting is essential for product and project managers to make data-driven decisions. In this article, we explore: What performance reporting is Why it is important What to include in a performance report How to create performance reports The best analyticstools for performance reporting Let’s get right to it!
As you’re researching customer analytics platforms, you’ve probably noticed how hard it is to find reliable information on the available solutions. TL;DR Customer analytics platforms are specialized tools that allow you to collect and analyze data. Starts with Einsten Predictions’ $75/month billed annually.)
SaaS tools are the industry's biggest open secret. Wondering what type of tools you should have in your stack? TL;DR SaaS tools are applications that users can access through an internet connection. There are different types of SaaS tools for different purposes. ProductPlan is the best tool for road mapping.
With Userpilots mobile solution , you can personalize in-app flows, trigger context-aware push notifications, and capture real-time insights: all without writing a single line of code. Userpilot is a no-code digital adoption platform that unifies mobile and web engagement, analytics, and feedback. But it doesnt have to be that way.
Instead, we must go back to the age-old mantra that a picture is worth a thousand words and provide a visual representation of what the future could look like if we are successful. Design: Customer Discovery Insights. Whenever you are surprised it means you've collected a valuable insight. Design: Product Roadmap.
As a product manager, Ive seen it become a constant loop of juggling SDKs, waiting on engineering sprints, patching together feedback tools, and praying your analytics make sense. Not another tool you have to duct tape into your stack, but one platform to build, test, and improve mobile experiences.
They focus all of their time and resources on building a great app. Landing pages can be set up with no cost or hassle with a tool like Squarespace or Wix. If you’re to integrate analytics, Squarespace is readily equipped for A/B testing and Wix has a number of plug-ins that will do the trick.
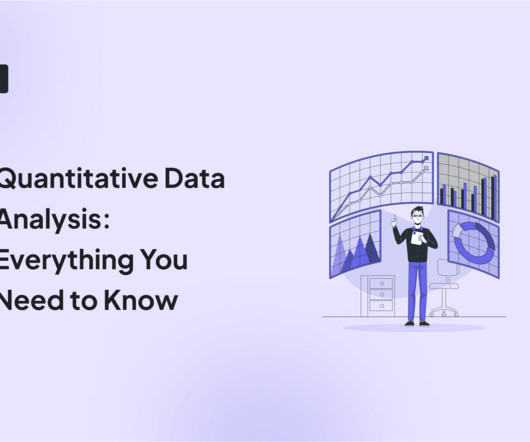
Does the thought of quantitative data analysis bring back the horrors of math classes? But conducting quantitative data analysis doesn’t have to be hard with the right tools. Want to learn how to turn raw numbers into actionable insights on how to improve your product? Collecting and cleaning data.
Most companies are torn between two options: build vs. buy product analytics. Today’s article provides a practical guide to help you decide whether to build or buy your product analyticstool. Build your own embedded analytics solution when you need: A custom analytics platform for internal and customer needs.
The “shiny penny” approach (focus all your attention on the hottest tools in the market) or “head in the sand” approach (fall victim to analysis paralysis and avoid choosing any tools) are no longer viable. But here’s the thing: a tool is not a strategy. The anatomy of a marketing tech stack [with recommended tools].
When it comes to boosting your product growth, user tracking tools can make your life a lot easier. They offer insights into product performance , what your users are doing inside your product, and why they are doing it. But how do you know you’re picking the right tools? Tableau is the best user datavisualizationtool.
Challenge #1: Limited team bandwidth, resources, and budget. Not only that, but 49% say those interactions are highly complex, and 32% report that there have been more emotional customer support interactions. The solution: Optimize your resources with the Conversational Support Funnel.
We organize all of the trending information in your field so you don't have to. Join 96,000+ users and stay up to date on the latest articles your peers are reading.
You know about us, now we want to get to know you!
Let's personalize your content
Let's get even more personalized
We recognize your account from another site in our network, please click 'Send Email' below to continue with verifying your account and setting a password.


Let's personalize your content