This site uses cookies to improve your experience. To help us insure we adhere to various privacy regulations, please select your country/region of residence. If you do not select a country, we will assume you are from the United States. Select your Cookie Settings or view our Privacy Policy and Terms of Use.
Cookie Settings
Cookies and similar technologies are used on this website for proper function of the website, for tracking performance analytics and for marketing purposes. We and some of our third-party providers may use cookie data for various purposes. Please review the cookie settings below and choose your preference.
Used for the proper function of the website
Used for monitoring website traffic and interactions
Cookie Settings
Cookies and similar technologies are used on this website for proper function of the website, for tracking performance analytics and for marketing purposes. We and some of our third-party providers may use cookie data for various purposes. Please review the cookie settings below and choose your preference.
Strictly Necessary: Used for the proper function of the website
Performance/Analytics: Used for monitoring website traffic and interactions
Without effective UX analytics that goes beyond collecting data, you’re losing valuable customers. Unfortunately, the research backs this up, with a staggering 90% of usersreporting that they stopped using an app due to poor performance. Basically, anything that ruins the userexperience.
Think of Net Promoter Score (NPS) software as a tool to measure your customers’ feelings about your product, and categorize them based on their level of loyalty (promoters, neutrals, and detractors). The great advantage of these tools is that they streamline the creation, distribution, and analysis of NPS surveys.
While “use data to drive decision-making” sounds obvious, there’s a HUGE gap between saying it and doing it well. So, how do you get started with product analytics ? In this article, we’ll talk about: What product analytics is and why you need a solid strategy. What is product analytics?
You can gather all the user feedback or behavioral data you want or even generate tons of Google Analyticsreports. Despite all these efforts, you’re probably still not acting on product analytics correctly. Why actionable product analytics are important. This causes siloed data and integration issues.
Dashboard design can mean the difference between users excitedly embracing your product or ignoring it altogether. Great dashboards lead to richer userexperiences and significant return on investment (ROI), while poorly designed dashboards distract users, suppress adoption, and can even tarnish your project or brand.
Introduction to customer satisfaction surveys Customer satisfaction surveys are vital tools for understanding what customers think, feel, and experience. Surveys provide a range of insights, from quick feedback after a purchase to in-depth assessments of brand loyalty. Don’t worry, we’ve got you.
Most product teams get mobile app analytics wrong. They track 47 different key performance indicators (KPIs) in their mobile analytics platform , spend hours debating dashboard numbers, yet can’t predict which users will churn next week The problem here isn’t a lack of data.
When your company adopts multiple SaaS solutions to drive productivity, you unknowingly create a perfect storm for data fragmentation. Your customer information lives in Salesforce, while your support tickets are in Zendesk, your product usage data in Mixpanel, and your marketing campaigns in HubSpot. Sound familiar?
You see, although we work hard to make Userpilot the best product adoption tool on the market, we know it isnt the perfect fit for every business. You get something that truly works for you, and we get to connect with people who value what we offer and have the potential to become power users (and sources of sustainable revenue!).
Think your customers will pay more for datavisualizations in your application? But today, dashboards and visualizations have become table stakes. Discover which features will differentiate your application and maximize the ROI of your embedded analytics. Brought to you by Logi Analytics.
Reveal Embedded Analytics We know how difficult it is to create dashboards, especially for web applications. However, running business operations or targeted campaigns without insights into their effectiveness is not an option. Thats what dashboards are for. They track everything from user behavior to system performance.
You know your product collects tons of data. Datavisualizationtools help turn your messy spreadsheets into clear, interactive insights. The best ones dont even need SQL or data science skills. Because product analytics should be easy and accessible for everyone, not just data experts.
Reveal Embedded Analytics For product owners, leveraging data is not just an advantageits a necessity. Product analytics empowers you to understand gaps in your offering and how users engage with your product. Both embedded analytics and product analytics are designed to help product owners in diverse ways.
It’s what you do with the behavior data your app collects. And by behavior data, I dont mean installs (thats the easy part). I mean what happens after the download: how users navigate, what features they engage with, and where they drop off. Why track in-app user behavior? Whereas a power user is active daily.
In this blog, we explore 5 key principles that exist to ensure you create a relevant dashboard that guides and simplifies the userexperience, makes it as easy as possible to interpret what is presented no matter its complexity, and increases the adoption of BI.
Case Study: Improving Data-Driven Decision Making for CSR Leadership Civian is a data-driven platform designed to help businesses measure, optimize, and showcase the social and economic impact of their investments in communities. Feature Engagement Users most frequently gravitated toward the map to explore and compare data.
If you’re shopping around for a mobile app analytics platform before biting the bullet with Fullstory, you’ve landed in the right place. FullStory is a robust web and analyticstool but there are platforms out there that may specialize in one of the features you want. Best for AI-powered future outcomes predictions.
How Rumi Cosmetiques Boosted UserExperience and Conversion Rates in eCommerce: A Case Study for Marketers andManagers Discover how Rumi Cosmetiques achieved a 75% increase in cart adds and doubled conversion rates by enhancing userexperience and conversion rate in eCommerce.
Reveal Embedded AnalyticsData-driven companies have a hidden advantage! Theyve consistently outperformed their counterparts, reporting significantly higher metrics across operational efficiency (81% vs. 58%) , revenue growth (77% vs. 61%), and employee satisfaction (68% vs. 39%). How is this possible?
A customer sentiment dashboard is a great way to visualize customer feedback and see what users love (or hate) about your product. But how do you collect the right data for your analysis? This article shows you a step-by-step process and some of the best tools to use. However, a single data source (e.g.,
Are you struggling to make sense of scattered userdata? The right customer analytics platform helps you uncover exactly how customers interact with your product: so you can spot issues early, optimize user journeys, and drive sustainable growth. Pendo – the best software for product-led insights.
I’m going to take a wild guess and assume that you already understand the importance of mobile in-app feedback tools. You also might be reading this post thinking: “Who’s adding new tools to their tech stack right now?” Do you have the right tools to capture that voice? Mobile in-app feedback tools & solutions.
The choice is tough because there’s no single tool that covers all use cases. What’s worse, you will find multiple tools in each category, making it incredibly difficult to pick the tool that satisfies your needs and offers the best value for money. Which product feedback software should you choose for your SaaS?
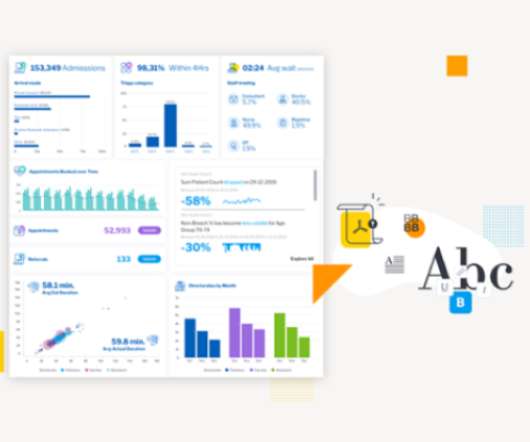
A product adoption dashboard helps you visualize key adoption metrics so you can make data-driven decisions and boost user engagement. In this article, we cover the following: Why you need a product adoption dashboard. Steps to measure adoption using a comprehensive dashboard. Define your main objectives.
Reveal Embedded Analytics This update is packed with customization, usability, and performance improvements to help you build seamless, high-impact analyticsexperiences faster. Fixed Lines for Charts: Set static reference points to highlight key data trends. Build on-brand, scalable analytics today.
Would you like to learn how to design a SaaS metrics dashboard for your team without any coding? In the article, you will find examples of various SaaS dashboards and learn how to create them with Userpilot analytics. We also explain what metrics you may want to track and how to use the insights they offer.
Userexperience can make or break a web app. If your software is slow or buggy, users wont stick around for long. If youre only finding out about these issues after users complain, youre already too late. On top of that, Userpilot also offers in-app engagement tools you can use to act on the collected data.
Reporting vs. analytics – which should you choose for your business? While a growing number of businesses are increasingly adopting reporting and analytics , the difference between both terms can be confusing. Essentially, reports communicate information, while analytics provide context and insight.
What happens when you build a product or service around what you think potential customers want, only for them to buy something else? It could include conducting user interviews and surveys, analyzing product usage data, and tracking customer feedback , to name a few.
In a fast-paced industry like SaaS, leveraging business analytics effectively can be the key to staying competitive and driving product growth. Business analytics offers invaluable insights that help SaaS companies optimize operations, enhance customer experiences, and make data-driven decisions.
Written by Alex Kreger and UXDA team Digital banking has undergone significant transformation over the past decade, yet many users still experience stress and confusion when managing their finances online. It is also counterintuitive to think that less information might actually benefit users.
In SaaS, a new user activation dashboard can become a massive product analyticstool to understand and optimize the user journey. But how can a dashboard for user activation can help you engage more users? moment ," impacting user retention and satisfaction.
When users interact more, it may seem like a win. However, without qualitative feedback and behavioral insights, teams risk misreading signals, leading to frustration and churn. Numbers alone can be misleading higher engagement doesnt always mean user satisfaction. Key differences between data types.
When it comes to product management, you need to look at different SaaS dashboard examples to see what kind of product analytics you can measure, and how. So what are the most important types of dashboards and which ones are the best for you? Ready to transform your data into actionable insights?
A self-servicedata platform is the backbone of informed decision-making and a growing SaaS business. But how do you choose the right data platform for product analytics ? Let’s go over what a data platform is, its importance, and the must-have features you should consider to choose the right platform for you.
Quantitative data alone doesn’t reveal intent, only outcomes. Thats why you need user session analysis. By combining contextual insights from session replays , heatmaps, and behavior analytics, user session analysis helps you interpret metrics through the lens of real user journeys.
Whatfix Mobile is a Digital Adoption Platform (DAP) specifically designed to enhance the experience for users of native Android and iOS apps. Whatfix delivers context-aware guidance that helps users correctly complete sensitive tasks like handling patient documents, uploading payroll data, etc., moment faster.
Analyticstools offer a competitive advantage for companies investing in prolonged product growth. However, not all companies can invest precious resources in an analyticstool. In reality, some companies are better served using free vs paid analytics platforms. There are different types of analyticstools.
Unfortunately, that technology isn’t here yet, so UX research tools are the next best thing. These tools can provide you with the qualitative and quantitative data you need to understand how your customer behaves in your product, so you can make the necessary changes to improve their experience.
If so, you need to invest in the right customer insighttools. These tools are perfect for providing valuable customer insights to make product improvements and optimize your customer experience. Amplitude offers deep user interaction insights and advanced analytics to enhance customer engagement.
Do you have the right tools to capture that voice? To help you with this, we compiled a list of the top mobile in-app feedback tools of 2021. Incorporating these tools into your customer experience tech stack will drive more engagement, gather high-quality customer feedback, and help inform your product roadmap.
Customer intelligence (CI) data and insights are instrumental in product management. They also help create a personalized customer experience and improve product adoption. However, with so many customer intelligence tools available, how do you select the right one? Book a demo now to see it in action.
You can get the answers you need simply from product management analyticstools. To help you know which tool to use, this article will cover the ten best product analyticstools. TL;DR Product analyticstools analyze user interaction, preferences, and engagement with a product.
As a product manager, Ive seen it become a constant loop of juggling SDKs, waiting on engineering sprints, patching together feedback tools, and praying your analytics make sense. Meanwhile, your users churn because they find the app confusing. It connects to tools like Segment, Amplitude, or Mixpanel.
We organize all of the trending information in your field so you don't have to. Join 96,000+ users and stay up to date on the latest articles your peers are reading.
You know about us, now we want to get to know you!
Let's personalize your content
Let's get even more personalized
We recognize your account from another site in our network, please click 'Send Email' below to continue with verifying your account and setting a password.


Let's personalize your content