Remove Dashboard Remove Data Remove Differentiation Remove Messaging
article thumbnail

Customer Engagement Dashboard: Which Metrics to Track and How to Create One

Userpilot

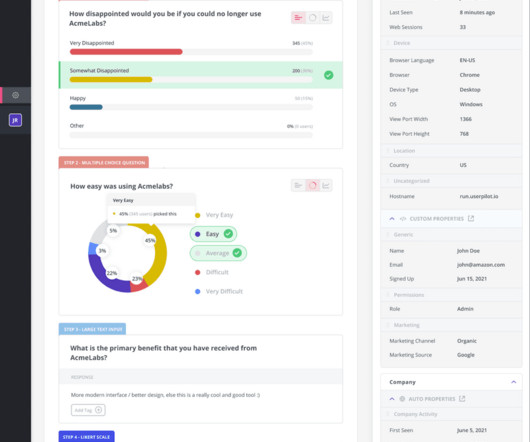
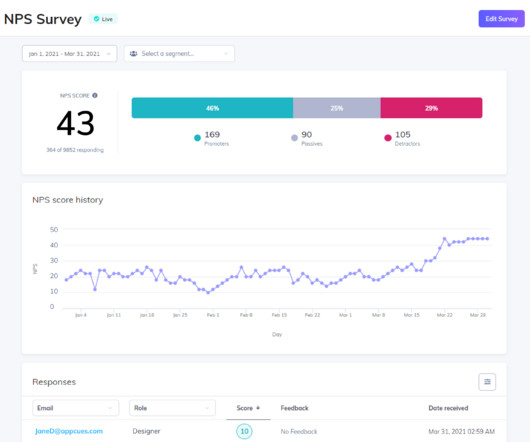
A customer engagement dashboard is invaluable for interpreting customer data and making the right business decisions. Read on to learn how to choose the right engagement metrics for your dashboard and how to build one code-free. If unsure, dig into your engagement data and interact with other teams in your company.

article thumbnail

10 Data Visualization UX Best Practices in SaaS

Userpilot

Understanding data visualization UX best practices is key to creating compelling visuals that produce digestible insights, empowering users to make informed product management decisions. TL;DR Data visualization is the visual and graphic representation of data using charts and graphs. This will make your data more actionable.

Insiders

Sign Up for our Newsletter

This site is protected by reCAPTCHA and the Google Privacy Policy and Terms of Service apply.

Trending Sources

article thumbnail

12 Best Customer Insight Tools for SaaS Companies in 2024

Userpilot

Businesses collect customer insights through data monitoring, surveys , interviews, support interactions , and social media. A few of the major features to look out for in customer insight platforms are user surveys, behavior analytics , segmentation , and data visualization.

article thumbnail

Built for you: Tooltips, new support languages, personalized posts, and much more

Intercom, Inc.

It’s no secret that customer experience is the key differentiator for online customers today. Include a basic message, embed an explainer video, or connect your Tooltip to the rest of Intercom – empowering you to share relevant Articles, kick off a Product Tour, prompt a survey, and more. The ability to filter by question and answer.

article thumbnail

Gaming Analytics: How to Leverage Your Customer Data for Sustained Business Growth

Indicative

Gaming data is one of the most valuable sources of information out there. . You need an analytics solution and data strategy that can help make that information useful. . Indicative aims to help companies find more value in their data — and how those numbers tie back to key performance metrics — in your business. .

article thumbnail

What Is Needs-Based Segmentation and How To Collect Data for It? [Best Tools Included]

Userpilot

Let’s jump in to see what needs-based segmentation is all about and how you can collect data for that to increase the growth of your business. Adopting a needs-based segmentation approach leads to a clearer understanding of the market and better-tailored messages for customer segments. Better tailored message for customer segments.

article thumbnail

Fintech Customer Experience: How to Measure and Improve It [+ Tools]

Userpilot

TL;DR The fintech customer experience helps neobanks, cryptocurrencies, and blockchain wallets differentiate themselves from traditional financial institutions. Conducting funnel analysis and using their event data to identify friction points can help you streamline their journey. Want to improve your fintech customer experience?