Remove Dashboard Remove Development Remove Engineering Remove Events
article thumbnail

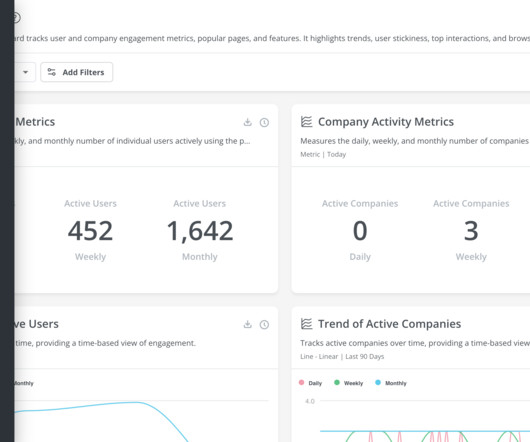
Mobile App KPI Dashboard Examples and How to Use Them

The Product Coalition

Learn about the importance of mobile app KPI dashboards and copy dashboards from real mobile app product managers, engineers and designers. A key performance indicator (KPI) dashboard is a visual representation of data that quantifies how well a team is performing towards its goals.

article thumbnail

10 Event Analytics Use Cases for SaaS [+ Examples]

Userpilot

Event analytics is a great way for SaaS companies to study user interactions to gain actionable insights into the customer journey. Knowing what steps users take to perform an event can help uncover friction points that are ruining the customer experience. Before diving into event analytics, you need to collect the right data.

Insiders

Sign Up for our Newsletter

This site is protected by reCAPTCHA and the Google Privacy Policy and Terms of Service apply.

Trending Sources

article thumbnail

Mixpanel for Event Tracking: Features, Pricing, and Review

Userpilot

Looking for an effective event tracking tool and wondering if Mixpanel is the best option for your SaaS company? In this article, we’ll delve into precisely that – helping you determine whether Mixpanel is the ideal choice for your event tracking needs. Looking for a Better Alternative for Event Tracking? Try Userpilot!

article thumbnail

How to get engineering buy-in (and even excitement) on product analytics

Mixpanel

At most companies, software engineers are in a constant state of rushing to get features and bug fixes out the door. This means product analytics can be seen as a burdensome afterthought for a lot of engineers —one that just adds more grind to an already packed schedule. Allow engineering to lay a strong analytics foundation.

article thumbnail

Best No Code Analytics Platform for Growth Insights

Userpilot

They usually come with drag-and-drop functionalities to allow users to create and track events without writing code. They come with user-friendly drag-and-drop interfaces, easy event tracking , and customizable dashboards. You can even use various filters to refine the data on its interactive dashboards.

article thumbnail

How Do Aha Moments Lead to Feature and Product Adoption?

Userpilot

To do so, first define the activation event and adoption event, and use them to conduct path analysis. In this way, you can map out and quantify all user actions leading to the event. You can then visualize them in a line graph to see which of them correlate with activation/adoption events. Does it lead to conversion ?

article thumbnail

Building a resilient system: Our journey to observability at Intercom

Intercom, Inc.

A typical workflow involved looking at a dashboard full of charts with metrics sliced and diced by various attribute combinations. That skill required constant practice – an unrealistic ask for the majority of product engineers who are busy delivering product. A typical operational dashboard we used before doubling down on traces.