Remove Data Visualization Remove Embedded Analytics Remove Training
article thumbnail

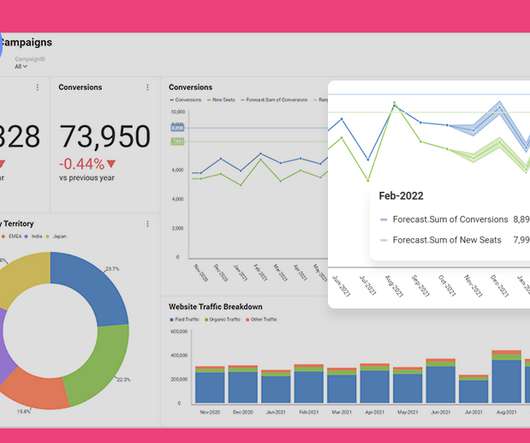
Top 12 Dashboard Reporting Tools For SaaS in 2024

Userpilot

As you’re researching dashboard reporting tools, you’ve probably noticed how hard it is to find reliable information on the available solutions. TL;DR Dashboards display critical business data in real-time, streamlining decision-making and focusing on key metrics. Let’s dive in!

article thumbnail

The Ultimate Guide to Embedded Analytics Requirements for 2025

Reveal

Reveal Embedded Analytics Data-driven companies have a hidden advantage! Theyve consistently outperformed their counterparts, reporting significantly higher metrics across operational efficiency (81% vs. 58%) , revenue growth (77% vs. 61%), and employee satisfaction (68% vs. 39%). How is this possible?

Insiders

Sign Up for our Newsletter

This site is protected by reCAPTCHA and the Google Privacy Policy and Terms of Service apply.

article thumbnail

How to Create a Successful Customer Expansion Strategy? (+Best Practices)

Userpilot

In this article, you will explore why customer expansion matters for your SaaS growth, discover various customer expansion tactics, and learn how to embed them in successful expansion campaigns. As your team grows and you hire new people or other departments adopt the tool, the number of seats needed increases.

article thumbnail

Y Oslo 2024: When It Comes to Discovery, Something is Better Than Nothing

Product Talk

This definition is a mouthful, so I like to visualize it. I’m going to walk through this visual quickly, and then Cecilie and I are going to dive into this in more depth. Using the Opportunity Solution Tree to Guide Discovery The visual at the center of this is called an opportunity solution tree. It’s that simple.

article thumbnail

Top Challenges for Embedded Analytics and How to Overcome Them

Reveal

Reveal Embedded Analytics. Embedded analytics is everywhere around us – in our cars, in our homes, in our security systems, in the digital advertising that we see while surfing the web, and even in the healthcare services we are being treated with. And that is because data nowadays is everything. Especially in business.

article thumbnail

Birst Named to Constellation ShortList™ for Cloud-Based Business Intelligence and Analytics Platforms for 4th Straight Time

Birst BI

Today, Constellation Research , a leading technology research and advisory firm based in Silicon Valley, announced that Birst, an Infor company, for the fourth consecutive time, has been named to the Constellation ShortList for Cloud-Based Business Intelligence and Analytics Platforms.

article thumbnail

10 Best Data Visualization Platforms for Product Managers

The Product Coalition

What is Data Visualization? More than just making numbers look pretty, data visualization is the graphical representation of information. Graphs, charts, maps, and tables are powerful communication tools, helping to make data more accessible. Why is Data Visualization important for Product Managers?