This site uses cookies to improve your experience. To help us insure we adhere to various privacy regulations, please select your country/region of residence. If you do not select a country, we will assume you are from the United States. Select your Cookie Settings or view our Privacy Policy and Terms of Use.
Cookie Settings
Cookies and similar technologies are used on this website for proper function of the website, for tracking performance analytics and for marketing purposes. We and some of our third-party providers may use cookie data for various purposes. Please review the cookie settings below and choose your preference.
Used for the proper function of the website
Used for monitoring website traffic and interactions
Cookie Settings
Cookies and similar technologies are used on this website for proper function of the website, for tracking performance analytics and for marketing purposes. We and some of our third-party providers may use cookie data for various purposes. Please review the cookie settings below and choose your preference.
Strictly Necessary: Used for the proper function of the website
Performance/Analytics: Used for monitoring website traffic and interactions
The right platform will equip you with the tools to interact effectively, gather valuable feedback, and build lasting customer relationships. How I chose the best customer engagement software My evaluation process combined thorough feature analysis , a careful review of user feedback, and insights from industry reports.
Collaboration often breaks down due to misalignment, unclear roles, and disconnected tools. It requires intention, empathy, clear structures, and the right tools. It is not always obvious who has the final say Tool sprawl. This is where strong leadership and the right tools can make all the difference.
Everyone’s talking about vibe coding , and how important it is to get your hands dirty by using the latest AI tools. I asked on X , LinkedIn , and my subscriber Slack community: What’s a product or tool you vibe coded that you actually use regularly in your work or life? And what tool/platform did you use to build it?
Cohort analysis is often overlooked, but it can yield insightful information and actionable advice to improve acquisition, retention and monetization. For successful implementation of an analytics program, rather than looking at all of your users as a single unit, cohort analysis breaks them into groups for analysis.
A few members of our Marketing team recently attended HubSpot’s Inbound 2017 conference in Boston, one of the year’s largest events for marketing professionals. We have frequently detailed the value of selling our ideas and decisions with data on this blog. How can I encourage support for a new OS before management thinks it’s time?
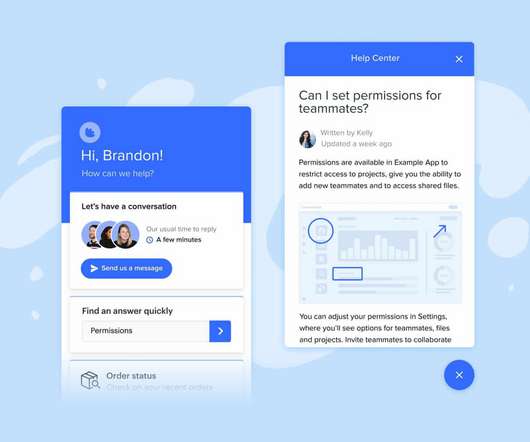
Good help center designs promote self-service, allowing users to find answers independently without waiting for support. The research backs this up, with companies that implement self‑service support centers reducing support call volume by 25–30%. Which is exactly how users prefer it. In short, there was a lot of inconsistency.
For anyone leveraging cloud computing, Amazon Elastic Container Service (ECS) continues to provide a seamless solution for managing containerized applications. Monitoring the performance of your containerized applications and services can be time-consuming. Are services scaling as expected? What are AWS ECS Metrics?
The “shiny penny” approach (focus all your attention on the hottest tools in the market) or “head in the sand” approach (fall victim to analysis paralysis and avoid choosing any tools) are no longer viable. But here’s the thing: a tool is not a strategy. The anatomy of a marketing tech stack [with recommended tools].
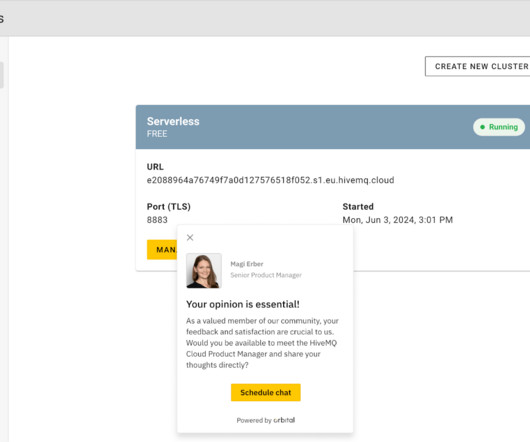
For today’s Tools of the Trade , we caught up with Yury Oleynik , the VP of Product Management at HiveMQ , who has managed to make continuous interviewing a reality on his team. Yury shares a few of the tactics his team tried to automate recruiting before they came across the tool they’re currently using, Orbital.
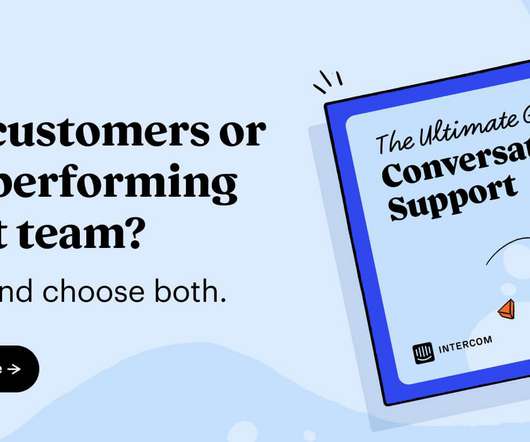
A recent Forrester Consulting study commissioned by Intercom, Drive Conversational Experiences For A Future-Ready Customer Support Strategy , revealed that 54% of teams can’t personalize support with their tech stack and 50% waste time jumping between tools. So before you begin searching for specific tools, define your goals upfront.
When it comes to boosting your product growth, user tracking tools can make your life a lot easier. They offer insights into product performance , what your users are doing inside your product, and why they are doing it. But how do you know you’re picking the right tools? Tableau is the best user datavisualizationtool.
Many support teams implemented the funnel and saw game-changing results, including reduced inbound conversation volume, faster resolution rates, and enhanced CSAT. But there was one problem – there was no quick way to gain a complete , visual view of how the funnel was working for your business. are performing best for your team.
Not only that, but 49% say those interactions are highly complex, and 32% report that there have been more emotional customer support interactions. A customer service agent can be on one phone call with one person at a time,” says Grayson Bagwell , Director of Business Development at Rugs.com.
As third-party data becomes less reliable, first-party analytics are going to shape most business decisions going forward. And the transition is already happening, as 88% of marketers think first-party data is more important now than a couple of years ago. While first-party data is completely private.
Data is the engine for SaaS, but without dataanalyticstools , your SaaS team will not be able to make sense of the data. The right set of SaaS analyticstools can help you generate actionable insights that fuel strategic decisions. But how do you ensure you’re picking the right tools?
Funnel reports are a popular analyticstool used to optimize customer journeys and user flows. Our guide explains how to build and analyze funnel reports for actionable insights. To create funnel reports in Userpilot , you first need to define the conversion events. Let’s get to it! Book the demo!
Below, we share how the outbreak has impacted three key support metrics – inbound volume, wait times, and CSAT scores – and advice from respected leaders on how to continue caring for your customers in a crisis. Inbound volume is spiking for half of support teams. The increased volume is affecting businesses of all types.
While this shift was already underway, the rate of digital transformation is now happening much faster than previously predicted due to the impact of the COVID-19 pandemic. According to the International Data Corporation (IDC) , 65% of global GDP will be digitalized by 2022, and investment in digital transformation (DX) continues to grow.
In the face of the massive change the support landscape is currently experiencing, the one constant is that many companies are receiving rising numbers of inbound customer requests. Specify who can start a conversation from the Messenger to prioritize and manage your inbound support volume during busy times.
But today, the underlying backbone of all of it is the right data. While science has always been part of sales, it’s hard to ignore the increasing importance of taking a data-driven approach to growing your business. As a sales rep, you need to be comfortable understanding the data behind your pipeline.
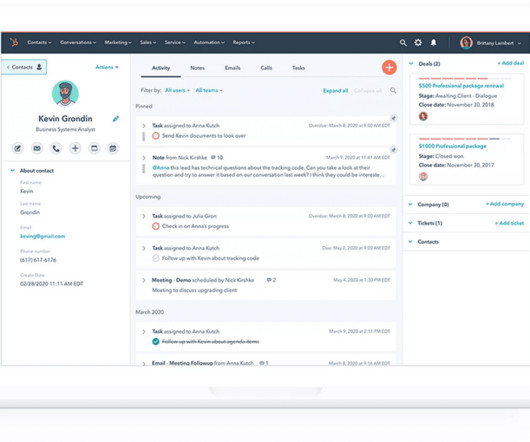
We’ve always used Intercom to provide support for our customers and, as our customer base has grown, we’ve seen first hand the needs for better reporting and workflows in Intercom. So over the years, we’ve been able to build internal tools to cater to our team needs. Customizable Inbox views that help you track key conversations.
By using technology to detect signals in their product and monitor trends in inbound conversations from customers, workforce management platform Tanda is leveraging proactive support to stay ahead of the curve and offer help to customers before they reach out to the support team. Here’s how they’re doing it. What is proactive support?
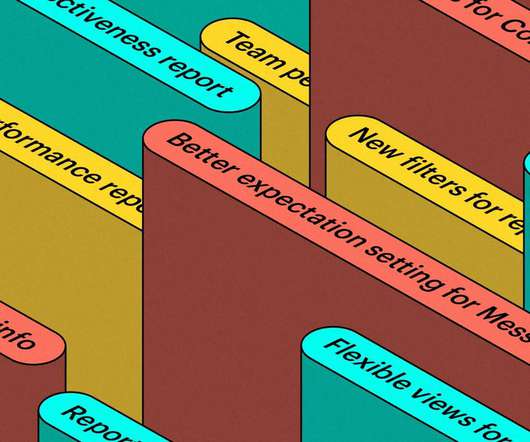
Over the last few months, we’ve released a bunch of new updates across everything from reporting to integrations to the mobile experience. With these improvements, you can discover deeper insights to help you optimize, personalize, and engage your customers, enabling you to hit your business goals and create a better customer experience.
Her responsibilities include building and evolving Crossmedia’s services in ways that reflect their commitment to do the right things for their people and their clients. It’s about using data to uncover insights and the best place, time, and way to speak to a consumer on behalf of a brand.
Podcasts are one of the best learning resources available, especially when it comes to breaking down technical subjects such as data science and analytics. To guide your learning, we put together the following collection of the best analytics-related podcasts to listen to. 113 | What Makes A Visualization Memorable?
. “Armed with the right data, your team will be able to move the needle on providing personal customer communication at scale” Meaningful insights fuel great experiences, but it can be challenging to draw them out when you’re constantly managing high volumes of inbound conversations.
For many years, B2B companies have executed their inbound sales funnel in a traditional manner that looked a little something like this: Visitor prospects. Using live chat for sales, you can: Qualify inbound leads using customizable bots that ask relevant, targeted questions. Marketing qualified lead (MQL). Sales qualified lead (SQL).
The internet is moving more businesses and people online, and driving a huge increase in inbound support volume. Future facing businesses are investing in much better customer experiences, moving beyond traditional support tools that are built around deflection as the solution to scale. The Conversational Support Funnel.
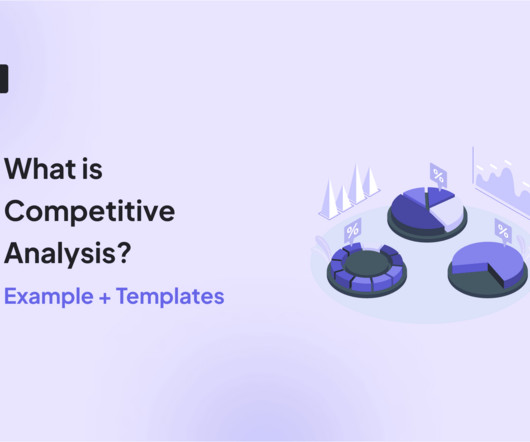
A thorough competitive analysis report includes an executive summary, company overview, product/service analysis, marketing/sales analysis, SWOT analysis, and conclusions/recommendations. Use user research tools such as surveys , interviews, focus groups, SimilarWeb, SEMrush, Ahrefs, and Crayon for competitor insights.
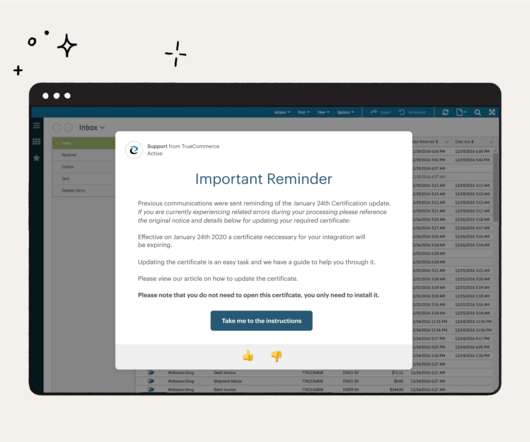
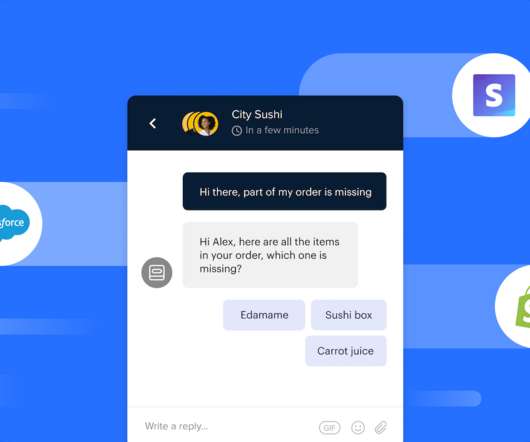
At Intercom, we’re striving to make our automation bots as powerful as possible, offering companies the fastest way to resolve queries in the face of ever-increasing inbound volume and customer expectations. Before today, our bots couldn’t easily access data living outside of Intercom. order status) as well as take actions (e.g.
TL;DR Customer experience management software is a tool or suite of tools designed to help businesses manage, track, and optimize customer experiences. Follow these steps to choose the right customer experience management tools for your business: Identify your needs. Ready to get started?
Global support teams can positively influence customer retention, especially if they provide service in their customers’ native language. You’ll either need to set up regional teams to provide round-the-clock coverage or look into self-service solutions such as chatbots or a knowledge base to help customers during off-hours.
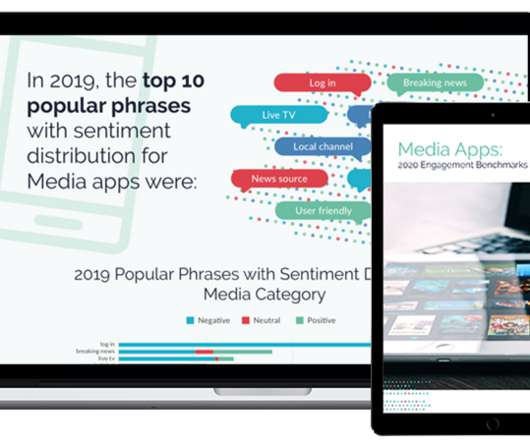
When you have solid benchmarks to measure against, they can help you make sense of your own data and answer these questions. ?Download Download the 2020 Mobile App Engagement Benchmark Report for Media Apps. Data from our 2016 , 2017 , 2018 , and 2019 reports is included to show shifts in brand focus and engagement over time.
In July, newly released research from Harvard Business Review AnalyticService, sponsored by Intercom, revealed what we’ve all been thinking – customer engagement is the key to retention and loyalty. Map your sender address to the inbound address your customers contact you from with Intercom’s updated sender address settings.
Staying personal meant offering expensive services that aren’t scalable like 1:1 phone calls or 24/7 real-time chat. They use self-service, bots, and automation to instantly answer customers’ common questions and provide support when your team is busy or out of the office. Either stay personal with customers or get efficient.
In our 2021 Mobile App Engagement Benchmark Report , a study of 1,000 apps across a billion+ app installs, we take a close look at apps in the Media and Entertainment category. In our data, Media apps are segmented into six subcategories: News (global news networks, newspapers, etc.).
How do you create top-notch data analysis reports? It also covers: Why you need data analysis reports. Different types of reports. Best analyticstools for creating data analysis reports. Trend analysis reports track patterns and shifts in data over time.
For instance, many teams build apps on Intercom so users can leverage their workflows and services within our live chat Messenger and messages. A predictive lead scoring tool for B2B SaaS companies, MadKudu’s strategy is all about integrating with other platforms – including Intercom – to link customer intelligence and customer engagement.
Customer service is the ongoing support provided to a customer throughout the entire customer journey. . You could argue that what constitutes a good customer service experience can vary by customer and industry, but there’s no denying that people’s expectations are higher than ever. . What is a customer service process?
Understanding how to choose CDP vendors that help you harness data, make the most of the insights you gather, and drive growth is a tricky challenge. In this article, we’re going to unpack what a customer data platform (CDP) is, explore the best tools out there, and share a few attractive alternatives.
Not only does this create a better customer experience, it also helps to reduce inbound conversation volumes for your support team so they can focus on answering more complex, high-impact questions. “59% It reduces inbound conversation volume without sacrificing customer happiness. The benefits of proactive support.
This also empowers your team to do what they do best – using their product knowledge, technical expertise, and empathy skills to keep customers satisfied and ensure they’re getting long-term value from your product or service. Seamlessly manage all of your tools from one inbox. It wastes both the agent’s and the customer’s time.
This topic was inspired by a question that came up in the CDH community, where a member was looking for specific tools people had used to run in-app surveys. While Orion had started with a B2C focus, they got a lot of inbound interest in the B2B space. The answer was then stored alongside other metrics data for each user profile.
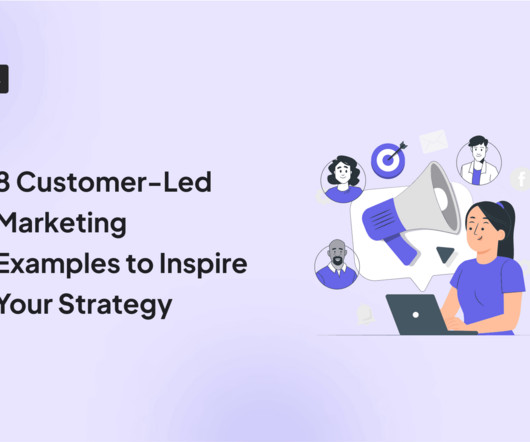
HubSpot gives a platform to its customers at Inbound conference. Userpilot offers different features for executing a customer-led marketing strategy, such as: Event analytics to understand the customer journey. Get a demo and see how Userpilot can help you collect useful data and trigger personalized experiences customers love.
We organize all of the trending information in your field so you don't have to. Join 96,000+ users and stay up to date on the latest articles your peers are reading.
You know about us, now we want to get to know you!
Let's personalize your content
Let's get even more personalized
We recognize your account from another site in our network, please click 'Send Email' below to continue with verifying your account and setting a password.


Let's personalize your content