This site uses cookies to improve your experience. To help us insure we adhere to various privacy regulations, please select your country/region of residence. If you do not select a country, we will assume you are from the United States. Select your Cookie Settings or view our Privacy Policy and Terms of Use.
Cookie Settings
Cookies and similar technologies are used on this website for proper function of the website, for tracking performance analytics and for marketing purposes. We and some of our third-party providers may use cookie data for various purposes. Please review the cookie settings below and choose your preference.
Used for the proper function of the website
Used for monitoring website traffic and interactions
Cookie Settings
Cookies and similar technologies are used on this website for proper function of the website, for tracking performance analytics and for marketing purposes. We and some of our third-party providers may use cookie data for various purposes. Please review the cookie settings below and choose your preference.
Strictly Necessary: Used for the proper function of the website
Performance/Analytics: Used for monitoring website traffic and interactions
Without effective UX analytics that goes beyond collecting data, you’re losing valuable customers. Unfortunately, the research backs this up, with a staggering 90% of usersreporting that they stopped using an app due to poor performance. Basically, anything that ruins the userexperience.
Think of Net Promoter Score (NPS) software as a tool to measure your customers’ feelings about your product, and categorize them based on their level of loyalty (promoters, neutrals, and detractors). The great advantage of these tools is that they streamline the creation, distribution, and analysis of NPS surveys.
While “use data to drive decision-making” sounds obvious, there’s a HUGE gap between saying it and doing it well. So, how do you get started with product analytics ? In this article, we’ll talk about: What product analytics is and why you need a solid strategy. What is product analytics?
Using a custom ChatGPT model combined with collaborative team workshops, product teams can rapidly move from initial customer insights to validated prototypes while incorporating strategic foresight and market analysis. Instead of focusing solely on today’s customer problems, product teams need to look 2-5 years into the future.
Dashboard design can mean the difference between users excitedly embracing your product or ignoring it altogether. Great dashboards lead to richer userexperiences and significant return on investment (ROI), while poorly designed dashboards distract users, suppress adoption, and can even tarnish your project or brand.
You can gather all the user feedback or behavioral data you want or even generate tons of Google Analyticsreports. Despite all these efforts, you’re probably still not acting on product analytics correctly. Why actionable product analytics are important. This causes siloed data and integration issues.
Jack brings 20 years of experience managing innovation projects at companies like Sony Ericsson and Logitech. He shares practical insights from the Product Development and Management Association (PDMA) framework and explains how product managers can use these principles to improve their product development process.
When your company adopts multiple SaaS solutions to drive productivity, you unknowingly create a perfect storm for data fragmentation. Your customer information lives in Salesforce, while your support tickets are in Zendesk, your product usage data in Mixpanel, and your marketing campaigns in HubSpot. Sound familiar?
Reveal Embedded Analytics For product owners, leveraging data is not just an advantageits a necessity. Product analytics empowers you to understand gaps in your offering and how users engage with your product. Both embedded analytics and product analytics are designed to help product owners in diverse ways.
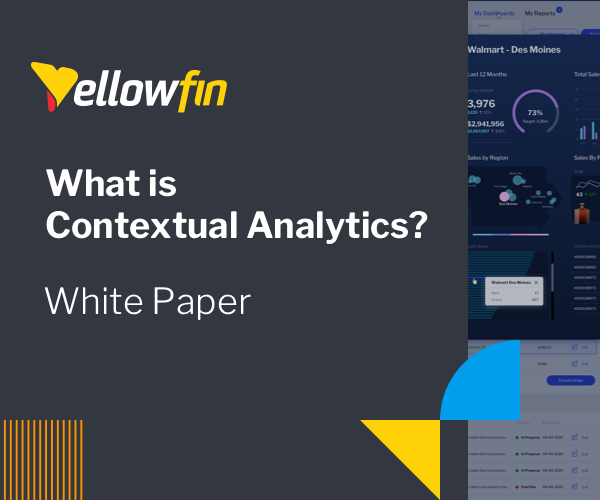
Download this whitepaper to learn what contextual analytics is, how BI platforms like Yellowfin revolutionize the way users discover insights from their data with native contextual analytics, and how it adds value to your software solution by elevating the userexperience.
You know your product collects tons of data. Datavisualizationtools help turn your messy spreadsheets into clear, interactive insights. The best ones dont even need SQL or data science skills. Because product analytics should be easy and accessible for everyone, not just data experts.
You see, although we work hard to make Userpilot the best product adoption tool on the market, we know it isnt the perfect fit for every business. You get something that truly works for you, and we get to connect with people who value what we offer and have the potential to become power users (and sources of sustainable revenue!).
Introduction to customer satisfaction surveys Customer satisfaction surveys are vital tools for understanding what customers think, feel, and experience. Surveys provide a range of insights, from quick feedback after a purchase to in-depth assessments of brand loyalty. Don’t worry, we’ve got you.
Drawing from his 20+ years of technology experience and extensive research, Nishant shared insights about how these activities vary across different organizational contexts – from startups to enterprises, B2B to B2C, and Agile to Waterfall environments.
🤔 This webinar brings together expert insights to break down the complexities of BI solution vetting. We’ll explore essential criteria like scalability, integration ease, and customization tools that can help your business thrive in an increasingly data-driven world.
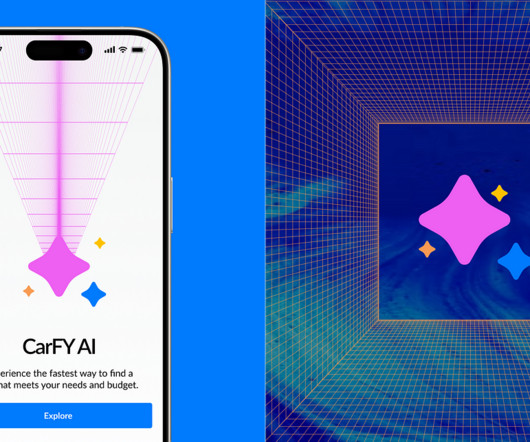
Transforming userexperience in cars-as-a-service industry through Strategic AI/ML Integrationa UX casestudy. Overview This case study focuses on integrating AI/ML to improve userexperience in the car-as-a-service automobile marketplace. Image Credit: Karena E.I Image Credit: Karena E.I
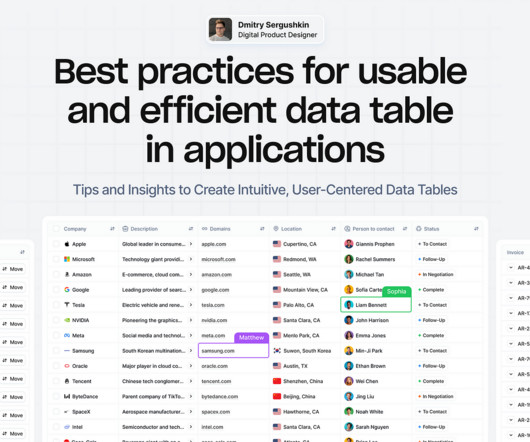
Tips and Insights to Create Intuitive, User-Centered DataTables Data tables provide a structured way to organize and manage information, making it easier to analyze and visualizedata effectively. Well-designed tables enable users to access, analyze, and act on critical information quickly and accurately.
Most product teams get mobile app analytics wrong. They track 47 different key performance indicators (KPIs) in their mobile analytics platform , spend hours debating dashboard numbers, yet can’t predict which users will churn next week The problem here isn’t a lack of data.
Reveal Embedded Analytics We know how difficult it is to create dashboards, especially for web applications. However, running business operations or targeted campaigns without insights into their effectiveness is not an option. Thats what dashboards are for. They track everything from user behavior to system performance.
Think your customers will pay more for datavisualizations in your application? But today, dashboards and visualizations have become table stakes. Discover which features will differentiate your application and maximize the ROI of your embedded analytics. Brought to you by Logi Analytics.
Reveal Embedded AnalyticsData-driven companies have a hidden advantage! Theyve consistently outperformed their counterparts, reporting significantly higher metrics across operational efficiency (81% vs. 58%) , revenue growth (77% vs. 61%), and employee satisfaction (68% vs. 39%). How is this possible?
Written by Alex Kreger and UXDA team Digital banking has undergone significant transformation over the past decade, yet many users still experience stress and confusion when managing their finances online. It is also counterintuitive to think that less information might actually benefit users.
The choice is tough because there’s no single tool that covers all use cases. What’s worse, you will find multiple tools in each category, making it incredibly difficult to pick the tool that satisfies your needs and offers the best value for money. Which product feedback software should you choose for your SaaS?
Wouldn’t it be great to see all user interactions with your product as they happen? Think about all the insights you could gather to improve the userexperience. Session recordings vs. heatmaps While both heatmaps and session recordings shed light on user interactions, they provide different insights.
In this blog, we explore 5 key principles that exist to ensure you create a relevant dashboard that guides and simplifies the userexperience, makes it as easy as possible to interpret what is presented no matter its complexity, and increases the adoption of BI.
How Rumi Cosmetiques Boosted UserExperience and Conversion Rates in eCommerce: A Case Study for Marketers andManagers Discover how Rumi Cosmetiques achieved a 75% increase in cart adds and doubled conversion rates by enhancing userexperience and conversion rate in eCommerce.
If there is one thing thats altering the way we create userexperience (UX) designs and conduct research in 2024, it is definitely artificial intelligence (AI). Well start with an overview and explore how AI can take on tasks such as analyzing userdata and automated prototyping to help professionals connect with users on a humanlevel.
Are you struggling to make sense of scattered userdata? The right customer analytics platform helps you uncover exactly how customers interact with your product: so you can spot issues early, optimize user journeys, and drive sustainable growth. Pendo – the best software for product-led insights.
Case Study: Improving Data-Driven Decision Making for CSR Leadership Civian is a data-driven platform designed to help businesses measure, optimize, and showcase the social and economic impact of their investments in communities. Feature Engagement Users most frequently gravitated toward the map to explore and compare data.
Most companies realize the value third party analytics solutions offer in delivering a best-of-breed capability to market quickly. However, end-user expectations have moved beyond what embedded analytics can offer and now encompass a seamless userexperience, easy to use self-service, and immediate data response times.
Userexperience can make or break a web app. If your software is slow or buggy, users wont stick around for long. If youre only finding out about these issues after users complain, youre already too late. On top of that, Userpilot also offers in-app engagement tools you can use to act on the collected data.
Reveal Embedded Analytics Today’s business users expect more than static dashboards or delayed reports. They want to explore live data, uncover insights, and take action in real time. However, delivering that experience inside a software product or platform is not easy.
Note that Ive decided not to state the names of the tools I found, partly as the AI landscape is changing rapidly and partly as you should research and select the tools that work best in your context rather than trusting my judgment. [2] 2] Market Research AI-based tools can discover user and customer trends using predictiveanalytics.
Reveal Embedded Analytics This update is packed with customization, usability, and performance improvements to help you build seamless, high-impact analyticsexperiences faster. Fixed Lines for Charts: Set static reference points to highlight key data trends. Build on-brand, scalable analytics today.
Speaker: Kirui K. K., Co-founder and CEO of Tanasuk Africa
If you want to offer a better userexperience, it can be tempting to track each and every data point in your product. However, this can quickly get complicated and overwhelming as you collect more and more data. Pick the analytics you need to make an impact. How do you know which metrics will help you improve?
offers guidance to a user who failed to toggle the publish button. Other gamification elements include: Rewards Badges Creativity tools Pressure Progress bars Challenges Explore more gamification examples. For example, can you host webinars to educate users about product updates and offer industry insights? The result?
Considering the Amplitude session replay feature and wondering if it’s the right tool for your business? We also reveal an alternative tool with even more expansive features and excellent value for money. Raw replay data is stored for 30 days by default but can be extended to 12 months by purchasing extra retention time.
And Im not talking about pretty visuals for the sake of it. I mean frictionless, user-obsessed, data-driven design choices that guide your customer from just browsing to Add to Cart without ahiccup. The secret often lies in the art of UserExperience design. So, what exactly is a conversion funnel ?
It’s what you do with the behavior data your app collects. And by behavior data, I dont mean installs (thats the easy part). I mean what happens after the download: how users navigate, what features they engage with, and where they drop off. Why track in-app user behavior? Whereas a power user is active daily.
Speaker: Jay Allardyce, Deepak Vittal, Terrence Sheflin, and Mahyar Ghasemali
As we look ahead to 2025, business intelligence and dataanalytics are set to play pivotal roles in shaping success. Understanding these trends is not only essential to staying ahead of the curve, but critical for those striving to remain competitive and innovative in an increasingly data-driven world.
The Rules Are Blocking Your Progress These so-called “best practices” promise structure and alignment, but they often trap teams in a cycle of predictability and prevent breakthroughs. We know roadmaps provide structure, alignment, and predictability. Lets take them apart. and pursue the answers. Spoiler alertthey wont.
Well implemented, product demos help to: Improve user engagement : Today’s B2B buyers are independent—they want to research and evaluate solutions on their own terms. In fact, the 2024 Buyer ExperienceReport by 6sense found that a whopping 85% of buyers establish purchase requirements before even contacting sales.
Put simply, we craft smart products that transform mundane shopping experiences into personalized adventures, like suggesting the perfect pair of sneakers based on your unique sports styleall thanks to Predictive Analysis. Were on a mission to transform userexperiences, making every interaction a step toward greatersuccess.
In the rapidly evolving world of UserExperience (UX) research, one element often goes unnoticed but is absolutely critical: recruitment. While UX research focuses on uncovering insights to improve userexperiences, recruitment ensures that these insights are grounded in high-quality data.
Qualitative data from UXers should not compete against the quantitative data product owners need for their business model. Storyboarding is a simple way to start integrating both perspectives into a complete picture of how the userexperience impacts the business model. Qualitative vs. Quantitative is a silly argument.
We organize all of the trending information in your field so you don't have to. Join 96,000+ users and stay up to date on the latest articles your peers are reading.
You know about us, now we want to get to know you!
Let's personalize your content
Let's get even more personalized
We recognize your account from another site in our network, please click 'Send Email' below to continue with verifying your account and setting a password.


Let's personalize your content