This site uses cookies to improve your experience. To help us insure we adhere to various privacy regulations, please select your country/region of residence. If you do not select a country, we will assume you are from the United States. Select your Cookie Settings or view our Privacy Policy and Terms of Use.
Cookie Settings
Cookies and similar technologies are used on this website for proper function of the website, for tracking performance analytics and for marketing purposes. We and some of our third-party providers may use cookie data for various purposes. Please review the cookie settings below and choose your preference.
Used for the proper function of the website
Used for monitoring website traffic and interactions
Cookie Settings
Cookies and similar technologies are used on this website for proper function of the website, for tracking performance analytics and for marketing purposes. We and some of our third-party providers may use cookie data for various purposes. Please review the cookie settings below and choose your preference.
Strictly Necessary: Used for the proper function of the website
Performance/Analytics: Used for monitoring website traffic and interactions
Ever wonder why some products instantly click with users while others get abandoned faster than New Year’s resolutions? The secret often lies in those crucial first moments – your useronboarding. But here’s the thing: getting users to say “wow” instead of “why?”
So, how do you get started with product analytics ? In this article, we’ll talk about: What product analytics is and why you need a solid strategy. Key steps to build and improve your product analytics strategy. How to apply actionable metrics to different SaaS business stages. What is product analytics?
Tracking mobile app performance metrics can feel daunting. You aim to extract meaningful insights to improve app performance and user engagement. But you find yourself puzzled, overwhelmed, and uncertain about which metrics truly matter. Ive also included the key metrics I track and recommend for every product team.
Can you imagine what the ideal SaaS customer onboarding process looks like? When done well, it can be the difference between a user becoming a loyal customer or churning after the first week. These will include: Userpilot Miro Slack Amplitude Mailchimp Airtable Loom Grammarly What is a SaaS onboarding process?
Thats why you need user session analysis. By combining contextual insights from session replays , heatmaps, and behavior analytics, user session analysis helps you interpret metrics through the lens of real user journeys. On the surface, it looks like a win. Tools can track every click and interaction.
Without measuring and aggressively improving the right mobile app metrics, youll struggle to stay afloat. Most apps experience 89.3%-98.7% churn within 30 days, and in-app purchase conversion rates are often below 5% for the small number of users who remain. This article will cover 14 metrics to help you achieve just that.
Poor performance includes slow loading times, complex design, confusing navigation, and unresponsive features. Basically, anything that ruins the userexperience. This article will help reduce such churn by refining your product management and UX analysis approach. How to start your UX analysis.
It’s no secret that learning how to evaluate product performance is essential for product management. But how can you effectively measure productmetrics that can help you reach your goals and increase revenue growth? Why not book a Userpilot demo to see how you can analyze and improve product performance continuously?
For me, effective mobile app onboarding is the difference between new users looking around our app and disappearing right after, or understanding our app value and becoming engaged users. This is crucial as data reveals that the average mobile app loses 77% of users within its first 3 days, and about 90% within the first 30.
What is an interactive product demo? An interactive demo is a self-guided walkthrough that uses tooltips, modals, hotspots, and other interactive elements to help users quickly explore your SaaS product. Why build interactive demos for your SaaS product? This results in faster Aha!
You see, although we work hard to make Userpilot the best product adoption tool on the market, we know it isnt the perfect fit for every business. Helping prospects find the right product is a win-win situation. Userpilots key features include: No-code Chrome extension for building in-app flows. Pendo The dashboard on Pendo.
Most product teams get mobile app analytics wrong. They track 47 different key performance indicators (KPIs) in their mobile analytics platform , spend hours debating dashboard numbers, yet can’t predict which users will churn next week The problem here isn’t a lack of data.
The only way to have a fighting chance is by focusing on the userexperience within your mobile app. Try to understand what the in-app user journey is like. Why aren’t app users engaging with it more? And how can you turn them into active users? What are app engagement metrics?
Its not just the design, features, or marketing. I mean what happens after the download: how users navigate, what features they engage with, and where they drop off. Mobile app tracking captures data on how users interact with your app, including actions such as screen views, button taps, session length, and feature usage.
Tracking the right usermetrics helps you precisely identify issues in the productexperience rather than feeling lost in a sea of data. In this article, Ill cover 10 crucial usermetrics every product manager should track to turn data into decisions that increase product adoption.
What is productexperience? Productexperience refers to the customer journey that takes place within the product itself, from a person’s first login to their last time using the application. Focusing on productexperience allows companies to deliver more value to customers and to increase their lifetime value.
Think of Net Promoter Score (NPS) software as a tool to measure your customers’ feelings about your product, and categorize them based on their level of loyalty (promoters, neutrals, and detractors). The great advantage of these tools is that they streamline the creation, distribution, and analysis of NPS surveys.
This powerful tool allows you to see your website or web app through your users’ eyes. It reveals the “why” behind their actions and unlocks valuable insights to improve the userexperience. Conversely, session replays don’t actually record a user’s screen in the traditional sense.
In SaaS, a new user activation dashboard can become a massive product analytics tool to understand and optimize the user journey. But how can a dashboard for user activation can help you engage more users? Book a Userpilot demo to see how you can boost user activation and drive business success.
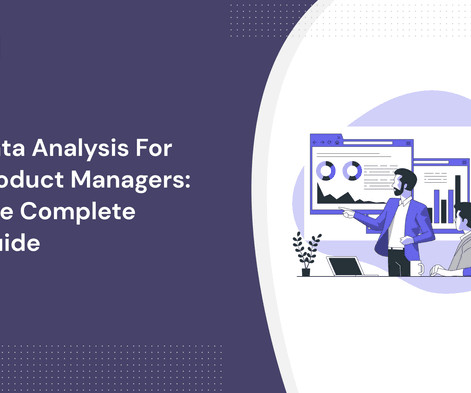
Data analysis is integral to a product manager’s job – it’s what helps them build impactful products. This article dives deep into data analysis for product managers. This approach is vital in modern product management , and every product manager needs to embrace it.
Through case studies, statistical evidence, and methodological frameworks, I aimed to establish how systematic user research can positively impact key business metrics, from acquisition to referral. This striking statistic illustrates the potential impact when growth decisions are grounded in robust user research.
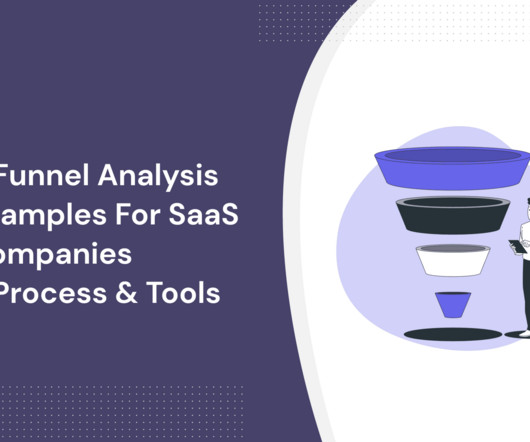
Funnel analysis examples can help product managers find the missing puzzle pieces to improve user journeys. From marketing funnel analysis to review funnel analysis, this article shows you the most important funnels for SaaS. Funnel analysis allows you to: Measure company performance. Activation funnel.
Period-over-period analysis is one of the key ways to drive sustainable SaaS growth. The data obtained from the process lets you adapt and refine your strategies, ensuring you make proactive moves to improve key growth metrics. This article shows you: Five simple steps to perform period-over-period analysis.
MarTech companies had the lowest onboarding c completion rates of all the industries we studied for our SaaS ProductMetrics Benchmark Report. Does it have any impact on new user activation, time-to-value, or other metrics? We also show you how you can improve the key success metrics for your MarTech SaaS.
” And that’s also why AARRR metrics are called pirate metrics. Short for acquisition, activation, retention, referral, and revenue, these metrics help you measure and drive product growth. In this article, we’ll dig deeper into the AARRR framework and the relevant metrics associated with each stage.
An interactive user guide is a set of UI patterns designed to work together and help customers understand how to use your product. Why are interactive user guides important? All product managers want to delight and engage their customers. Users get access to help just when they need it.
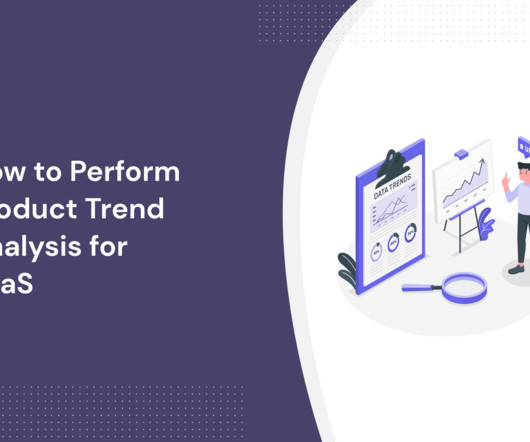
Trend analysis reports help you make data-driven decisions that boost SaaS performance metrics such as user activation, product stickiness, and retention. This article helps answer core trend analysis questions. TL;DR Trend analysis is the process of tracking and analyzing changes in key metrics over time.
Following UX best practices is essential to make the productexperience more intuitive and efficient. But which strategies are worth following to improve product engagement ? TL;DR UX design —short for UserExperience Design—focuses on creating products that offer meaningful and relevant experiences to users.
Performing trend and product analytics can help you make data-backed informed decisions to stay ahead of the competition. With trend analysis, you’ll be able to better understand both internal and external factors affecting your business operations.
Incorporating these tools into your customer experience tech stack will drive more engagement, gather high-quality customer feedback, and help inform your product roadmap. It provides the speed and efficiency mobile apps require for constantly changing products while maintaining the security and integrity of existing systems.
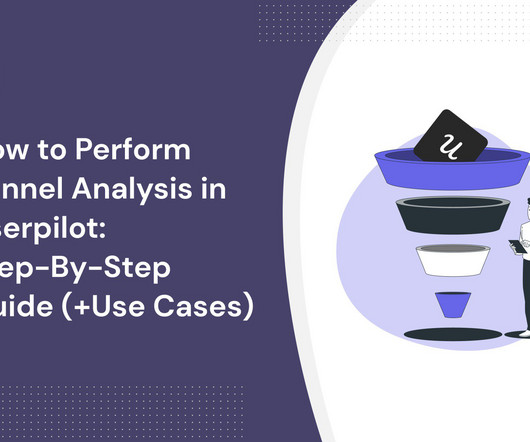
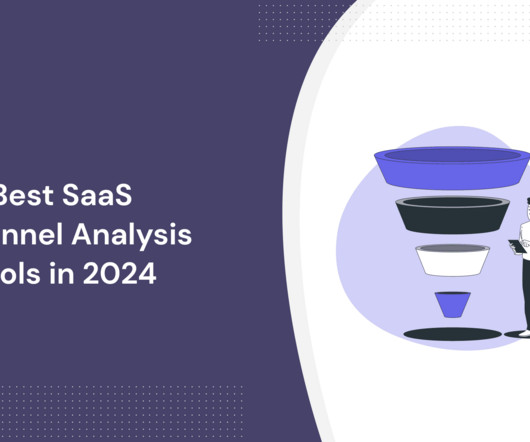
Curious to learn how to perform funnel analysis in Userpilot? You will also see common use cases where Userpilot’s funnel analysis tools come in handy. TL;DR Funnel analysis is a way to visualize and understand how users flow through your website or app. Spot friction in your user journeys. Retain users.
How does customer onboarding in banking work? You will also learn the main challenges involved in the onboarding process in banking, best practices and explore the best onboarding software tools for the job. Use checklists and walkthroughs to guide users quickly to product value. Let’s dive right in!
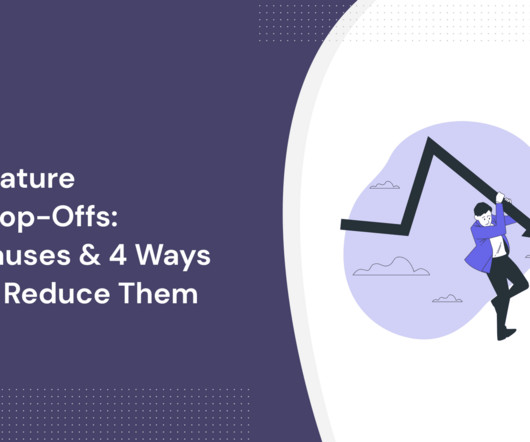
When left unaddressed, feature drop-offs lead to user dissatisfaction and result in churn. This article helps you identify and eliminate them by answering the following questions: Why do users stop using certain features? How can you identify drop-offs with product analytics and user surveys? Retention rate.
What is funnel analysis? What benefits does it bring to product teams? TL;DR Funnel analysis helps teams understand how many users complete a sequence of events leading to a conversion and how long it takes. Teams can use it to design personalized customer experiences for users at different stages of the journey.
A product adoption dashboard helps you visualize key adoption metrics so you can make data-driven decisions and boost user engagement. In this article, we cover the following: Why you need a product adoption dashboard. The most important metrics to track and why they matter. Understand how users adopt new features.
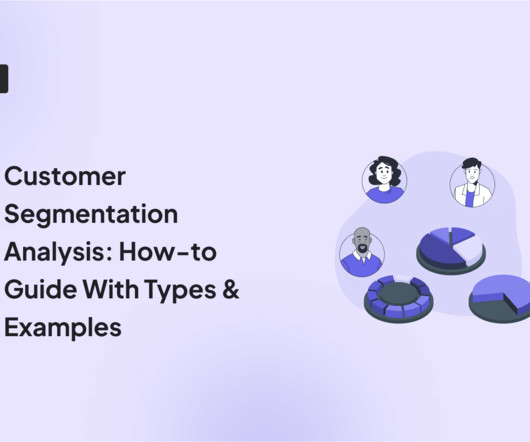
Customer segmentation analysis allows you to break down your users into distinct groups and gain valuable insights into them. In this article, you’ll learn about various types of customer segments you can identify and how to conduct a thorough analysis using the right product analytics tools.
We covered actionable steps to build an effective system that converts users, drives product engagement , and leads to long-term growth. TL;DR A SaaS marketing funnel outlines the steps users take from their initial awareness of your product to becoming loyal users. Book a demo to get started today!
According to Userpilot’s SaaS Product Success Metrics Benchmark report , Fintech and Insurance companies had the second-lowest activation and adoption rates of all industries. This is because the client onboarding process in financial services faces unique challenges. What are they? Let’s get started.
Having funnel analysis tools that provide comprehensive analytical insights about where and why users drop off will solidify your business’s competitiveness in the long term. TL;DR Funnel analytics refers to the analysis of events across all stages of every customer journey. Prices available upon request).
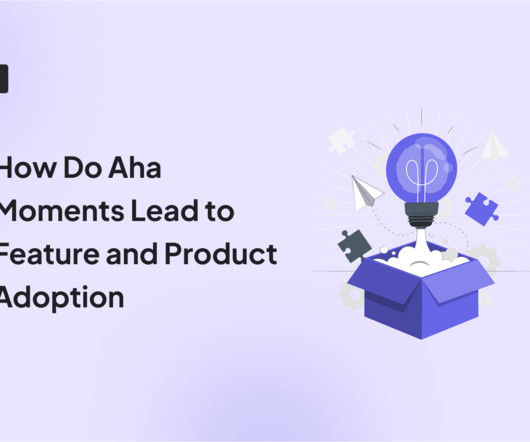
Wondering how Aha moments lead to feature and product adoption? The articles explains what the Aha moment is and what role it plays in user activation, product adoption , and customer retention. You will also learn how to find the Aha moment for your product and optimize it for different users.
Tracking product analytics , such as feature usage, is useful for understanding feature adoption and user engagement. Plus, it also helps gain valuable insights on how to enhance the customer experience and improve user retention. Metrics selection – which key metrics are most relevant to your goal?
While downloads are rolling in after months of development and a well-formed launch marketing plan, your mobile app adoption metrics show a concerning pattern: users sign up, look around, and quit the app almost immediately. 80% of users abandon apps within the first three days. Feature announcements. Congratulations!
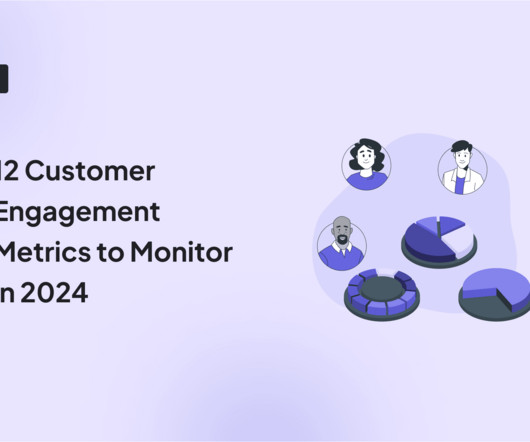
Wondering which customer engagement metrics to track? In this article, we discuss 12 key metrics you should cover – and why. We also look at the benefits of tracking user engagement for SaaS product teams! Time to Value (TTV) measures the duration it takes for customers to experience the product’s value.
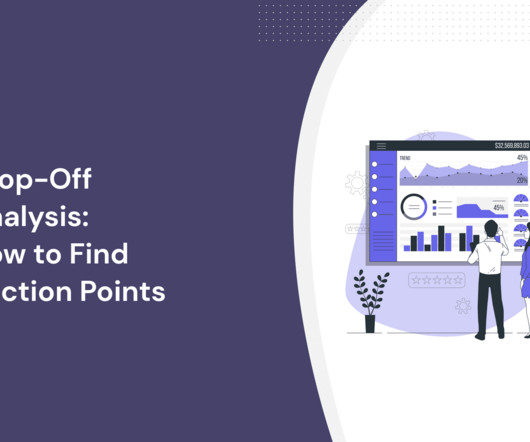
How do you conduct drop-off analysis to identify friction points in the user journey ? TL;DR The drop-off rate is the percentage of users who don’t complete an action or process. To calculate it, divide the number of users who finished the activity by the number of those who started. Let’s get right to it!
We organize all of the trending information in your field so you don't have to. Join 96,000+ users and stay up to date on the latest articles your peers are reading.
You know about us, now we want to get to know you!
Let's personalize your content
Let's get even more personalized
We recognize your account from another site in our network, please click 'Send Email' below to continue with verifying your account and setting a password.


Let's personalize your content