This site uses cookies to improve your experience. To help us insure we adhere to various privacy regulations, please select your country/region of residence. If you do not select a country, we will assume you are from the United States. Select your Cookie Settings or view our Privacy Policy and Terms of Use.
Cookie Settings
Cookies and similar technologies are used on this website for proper function of the website, for tracking performance analytics and for marketing purposes. We and some of our third-party providers may use cookie data for various purposes. Please review the cookie settings below and choose your preference.
Used for the proper function of the website
Used for monitoring website traffic and interactions
Cookie Settings
Cookies and similar technologies are used on this website for proper function of the website, for tracking performance analytics and for marketing purposes. We and some of our third-party providers may use cookie data for various purposes. Please review the cookie settings below and choose your preference.
Strictly Necessary: Used for the proper function of the website
Performance/Analytics: Used for monitoring website traffic and interactions
Without effective UX analytics that goes beyond collecting data, you’re losing valuable customers. Unfortunately, the research backs this up, with a staggering 90% of users reporting that they stopped using an app due to poor performance. It covers key topics, such as: Defining UX analytics. What is UX analytics?
While “use data to drive decision-making” sounds obvious, there’s a HUGE gap between saying it and doing it well. So, how do you get started with product analytics ? In this article, we’ll talk about: What product analytics is and why you need a solid strategy. What is product analytics?
Let’s review everything your customer success team has to do in the absence of any customer success tools. Collect customer data to calculate complex formulas for tracking metrics, monitor customer health scores, and resolve support tickets while continuously trying to improve retention and expansion.
Well, it’s not quite that simple – despite the influx of customer conversations, it can be hard to derive meaningful insights from all that data. Identifying the right insights is key to operating at scale while keeping your customer experience personal, but it’s a huge challenge to find the signal in the noise. No problem.
You see, although we work hard to make Userpilot the best product adoption tool on the market, we know it isnt the perfect fit for every business. Robust resource center functionalities for offering self-service help. Custom dashboards to track key metrics at a glance. for collecting user sentiment data.
Are you tracking SaaS metrics without knowing how to make the analytics process easier? Analyticsdashboards are visualizationtools that give you an overview of key metrics. This makes it much easier to extract insights from your analysis compared to looking at mere numbers. Book a demo to learn more.
It’s what you do with the behavior data your app collects. And by behavior data, I dont mean installs (thats the easy part). This article breaks down what mobile app tracking is, why it matters, and methods to do it well. All questions you can only answer with: Mobile app tracking. What is mobile app tracking?
Are you wondering how the new Userpilot custom analyticsdashboards can help you drive product growth? In this article, you will learn about the main benefits of custom product analyticsdashboards and how to create them in Userpilot. Userpilot is a robust analyticstool so you can use its own data.
Learn about the importance of mobile app KPI dashboards and copy dashboards from real mobile app product managers, engineers and designers. A key performance indicator (KPI) dashboard is a visual representation of data that quantifies how well a team is performing towards its goals.
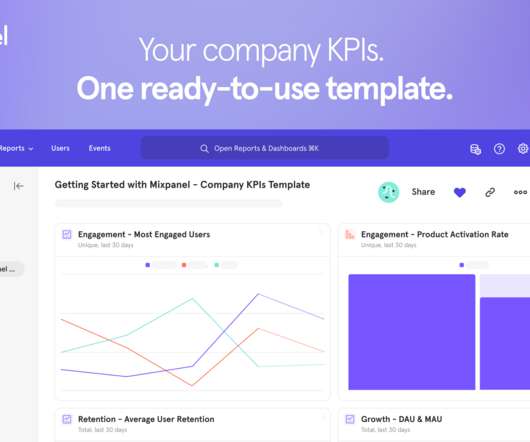
To take the guesswork out of measuring the right metrics, today we released the Company KPIs Dashboard template—nine out-of-the-box, fully customizable reports that make it easy for anyone to measure engagement, retention, and growth metrics. Other times, you need data to be accessible ASAP. Less effort, more value—faster!
In this article, you will explore why customer expansion matters for your SaaS growth, discover various customer expansion tactics, and learn how to embed them in successful expansion campaigns. As your team grows and you hire new people or other departments adopt the tool, the number of seats needed increases.
Visualdata surrounds us – colorful charts on weather reports, infographics on the web and in social media articles, map charts in presentations, etc. To help you get started with datavisualization, this article explores various visualization methods and their use cases. Funnel charts.
If you’re shopping around for a mobile app analytics platform before biting the bullet with Fullstory, you’ve landed in the right place. FullStory is a robust web and analyticstool but there are platforms out there that may specialize in one of the features you want. Best for AI-powered future outcomes predictions.
If you’ve landed on this article, you most likely already understand the immense value of capturing in-app customer feedback. What tools do you use? How do you manage all of that data? Appsee is a mobile app analytics platform that focuses on qualitative data and is designed to help inform UX decisions. Apptentive.
A customer sentiment dashboard is a great way to visualize customer feedback and see what users love (or hate) about your product. But how do you collect the right data for your analysis? This article shows you a step-by-step process and some of the best tools to use. However, a single data source (e.g.,
Wondering how to build a customer success dashboard for your team? From the article, you will learn what a customer success dashboard is, why you need it, and what metrics it should include. And how to build a dashboard for your customer success team using Userpilot analytics ! If so, we’ve got you covered!
A product adoption dashboard helps you visualize key adoption metrics so you can make data-driven decisions and boost user engagement. In this article, we cover the following: Why you need a product adoption dashboard. Steps to measure adoption using a comprehensive dashboard. Define your main objectives.
Customer intelligence (CI) data and insights are instrumental in product management. However, with so many customer intelligence tools available, how do you select the right one? In this article, we’ll take you through a list of the top customer intelligence tools. Book a demo now to see it in action.
Reporting vs. analytics – which should you choose for your business? While a growing number of businesses are increasingly adopting reporting and analytics , the difference between both terms can be confusing. Essentially, reports communicate information, while analytics provide context and insight.
Would you like to learn how to design a SaaS metrics dashboard for your team without any coding? In the article, you will find examples of various SaaS dashboards and learn how to create them with Userpilot analytics. We also explain what metrics you may want to track and how to use the insights they offer.
Dataanalytics plays an instrumental role at every step of building a successful product. Whether you’re building your user base or releasing a new feature, the right no-code analytics platform can help you make evidence-based decisions. Many of these tools even come with AI capabilities. Let’s get right to it.
What happens when you build a product or service around what you think potential customers want, only for them to buy something else? This article will walk you through what customer research really is, from choosing your research methodology to recruiting participants, analyzing feedback , and beyond.
However, without qualitative feedback and behavioral insights, teams risk misreading signals, leading to frustration and churn. User feedback is valuable , but without data, its just opinions. To eliminate these blind spots, you need to combine quantitative, qualitative, and visualdata. How to collect each data type.
By analyzing user behavior patterns and uncovering valuable insights, behavior analyticstools enable businesses to design strategies that drive retention and business growth. Discover the cutting-edge of behavioral analyticstools! There are different types of behavioral analyticstools used in SaaS.
New features like conversation data attributes , improved rules and assignment logic , and bots that help you triage conversations make it much easier to handle complex queries. New reporting metrics for more detailed insights. Keep tabs on key metrics by downloading or subscribing to the reports that matter to you.
Heap and Google Analytics are popular product analyticstools that help businesses pursue product growth with data-driven insights. In this article, we’ll go through the main differences between both tools to help you understand which one is better for you. respectively. What is Heap?
Analyticstools offer a competitive advantage for companies investing in prolonged product growth. However, not all companies can invest precious resources in an analyticstool. In reality, some companies are better served using free vs paid analytics platforms. There are different types of analyticstools.
Last month we turned our attention to data – unleashing new features that help you improve how you collect, access, and use first-party data to influence your product and scale your business. Surveys: Now even more insightful and engaging. Gain deeper insights with advanced reporting for Surveys.
What is data-driven analytics in SaaS? How to conduct user data analysis? What are the best analyticstools for the job? We answer these questions in the article, so if you’re looking for answers, you’re in the right place! Data collection comes next. Why is it important?
Today, almost any SaaS platform offers a reporting or insights module. A little investigative research on G2 uncovered the top 5 analytics UX mistakes made by SaaS vendors. Lack of relevant insights 55% of SaaS platforms receive complaints about relevancy. But how are users experiencing these features? What do they like?
Wondering how to leverage customer analytics benefits to drive customer satisfaction? Customer analytics helps you seamlessly understand customers, predict their needs, and curate your offerings to their wants. TL;DR Customer analytics involves gathering and interpreting customer data for actionable insights.
You can get the answers you need simply from product management analyticstools. To help you know which tool to use, this article will cover the ten best product analyticstools. TL;DR Product analyticstools analyze user interaction, preferences, and engagement with a product.
Example: Imagine you’re designing a new dashboard for a fintech app. Example: For our dashboard, we might ask, “How might we create a dashboard that helps analysts quickly spot trends and take action?” With AI tools like ChatGPT making waves, it’s natural to wonder how they fit into the sprint process.
Other gamification elements include: Rewards Badges Creativity tools Pressure Progress bars Challenges Explore more gamification examples. For example, can you host webinars to educate users about product updates and offer industry insights? Frequency of reported issue. No guesswork, just data. The result?
Explore the secrets of creating a successful Crypto Prediction and Opinion Platform, and provide users with insights to help them navigate the cryptocurrency market wisely. Crypto prediction platforms provide valuable insights into the volatile world of cryptocurrency markets, aiding users in making informed decisions.
What are user dataanalytics? From this article, you’re going to find out about different types of user data analysis and how to develop a user dataanalytics strategy that will help your team make data-driven decisions to enhance customer and product experience. What are user dataanalytics?
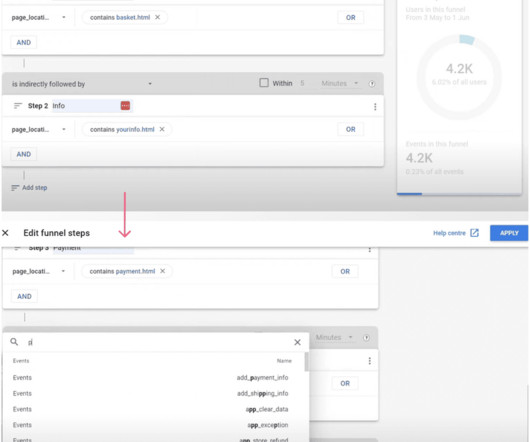
Want to conduct customer journey visualization but not sure what’s the best way to do it? This article shows you a step-by-step process for collecting customer data and creating easy-to-understand visual maps. Build data-driven product roadmaps. Visualize the journey with a customer journey map template.
Performance reporting is essential for product and project managers to make data-driven decisions. In this article, we explore: What performance reporting is Why it is important What to include in a performance report How to create performance reports The best analyticstools for performance reporting Let’s get right to it!
Does the thought of quantitative data analysis bring back the horrors of math classes? But conducting quantitative data analysis doesn’t have to be hard with the right tools. Want to learn how to turn raw numbers into actionable insights on how to improve your product? Collecting and cleaning data.
In either case, marketing analyticstools can come to your rescue. But with so many analytics solutions available in the market, how do you choose the right one? In this article, we’ll take a look at a few powerful marketing analytics software, focusing on their features and pricing.
SaaS tools are the industry's biggest open secret. Wondering what type of tools you should have in your stack? TL;DR SaaS tools are applications that users can access through an internet connection. There are different types of SaaS tools for different purposes. ProductPlan is the best tool for road mapping.
– lie beyond the realms of this article but one thing is clear: this market is HUGE. The “shiny penny” approach (focus all your attention on the hottest tools in the market) or “head in the sand” approach (fall victim to analysis paralysis and avoid choosing any tools) are no longer viable.
Understanding datavisualization UX best practices is key to creating compelling visuals that produce digestible insights, empowering users to make informed product management decisions. TL;DR Datavisualization is the visual and graphic representation of data using charts and graphs.
When it comes to boosting your product growth, user tracking tools can make your life a lot easier. They offer insights into product performance , what your users are doing inside your product, and why they are doing it. But how do you know you’re picking the right tools? Tableau is the best user datavisualizationtool.
We organize all of the trending information in your field so you don't have to. Join 96,000+ users and stay up to date on the latest articles your peers are reading.
You know about us, now we want to get to know you!
Let's personalize your content
Let's get even more personalized
We recognize your account from another site in our network, please click 'Send Email' below to continue with verifying your account and setting a password.


Let's personalize your content