Remove tag welcome
article thumbnail

How to Analyze Customer Data In SaaS? [Methods & Examples]

Userpilot

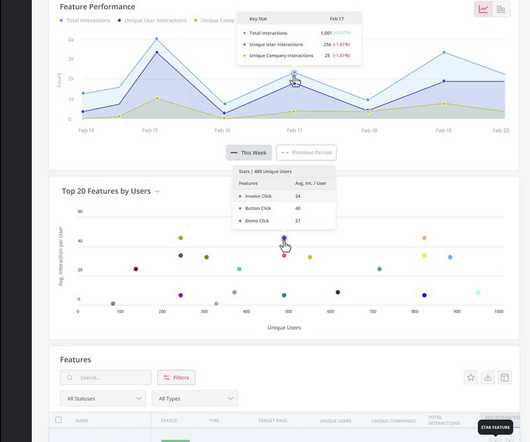
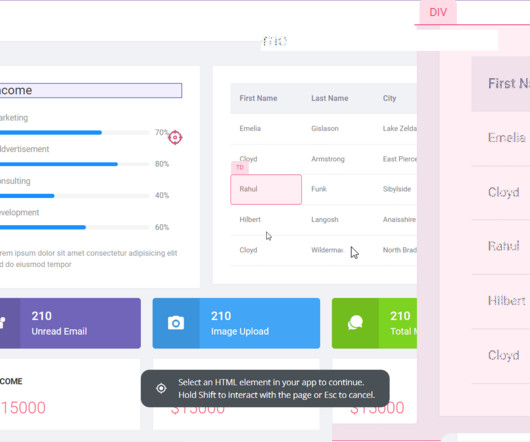
Start segmenting customers from day one by collecting user data with welcome surveys and asking about their jobs to be done. Monitor feature engagement with feature tagging, session recordings and heat maps , which provide a color-coded system to track customer engagement. Figma’s welcome screen. Feature tagging in Userpilot.

article thumbnail

Data Tracking: How to Create A Plan for Collecting and Analyzing Data?

Userpilot

To collect data for your tracking plan: Gather user data from welcome surveys right in the beginning. Use feature tagging to track feature usage. Collect customer data using welcome surveys You can start collecting customer data from the beginning of the user journey. Create welcome surveys in Userpilot.

Insiders

Sign Up for our Newsletter

This site is protected by reCAPTCHA and the Google Privacy Policy and Terms of Service apply.

article thumbnail

Goals vs Segments: What’s the Difference and How Use Them To Improve User Onboarding?

Userpilot

Goals address the ‘what’, while segments cover the ‘who’ Segment your customers using a welcome screen to collect user data and understand their jobs to be done. Along with goals, you can use feature tagging to track the engagement level for different features and see what your users are doing in-app.

article thumbnail

7 Actionable Tactics on Using Analytics To Improve Customer Engagement in SaaS

Userpilot

To improve customer engagement through analytics, you can use the following strategies: Greeting customers with welcome screens to capture customer data and personalize the onboarding. Filtering events and tagging features to trigger in-app experiences and encourage customers to interact more with the product. Where they are clicking.

article thumbnail

Usage Rate Segmentation in SaaS [Best Tools Included]

Userpilot

Use a microsurvey in the welcome flow to segment customers from the very beginning. Monitor what users are doing in the product with feature tagging and predefined goals. In addition to leaving impressive reviews, referring to their network, and tagging you on social media, they have a great deal to say about you.

article thumbnail

Survey Analytics: How to Collect and Interpret Survey Data?

Userpilot

You can interpret survey responses using survey analytics dashboards to visualize data, response tagging to discover feedback trends, and cross-referencing results with behavioral data to better understand user interactions. The image below shows a welcome survey included in the signup flow. Creating welcome surveys in Userpilot.

article thumbnail

What Is the Average Churn Rate for SaaS & 10 Tactics To Minimize It

Userpilot

Use welcome screens to collect customer data, create interactive walkthroughs to provide in-app guidance , and in-app banners to avoid involuntary churn. Use welcome screens to capture customer data and create a personalized flow. Welcome screens are not only helpful for greeting customers but also for collecting data.