This site uses cookies to improve your experience. To help us insure we adhere to various privacy regulations, please select your country/region of residence. If you do not select a country, we will assume you are from the United States. Select your Cookie Settings or view our Privacy Policy and Terms of Use.
Cookie Settings
Cookies and similar technologies are used on this website for proper function of the website, for tracking performance analytics and for marketing purposes. We and some of our third-party providers may use cookie data for various purposes. Please review the cookie settings below and choose your preference.
Used for the proper function of the website
Used for monitoring website traffic and interactions
Cookie Settings
Cookies and similar technologies are used on this website for proper function of the website, for tracking performance analytics and for marketing purposes. We and some of our third-party providers may use cookie data for various purposes. Please review the cookie settings below and choose your preference.
Strictly Necessary: Used for the proper function of the website
Performance/Analytics: Used for monitoring website traffic and interactions
Introduction to customer satisfaction surveys Customer satisfaction surveys are vital tools for understanding what customers think, feel, and experience. Surveys provide a range of insights, from quick feedback after a purchase to in-depth assessments of brand loyalty. Don’t worry, we’ve got you.
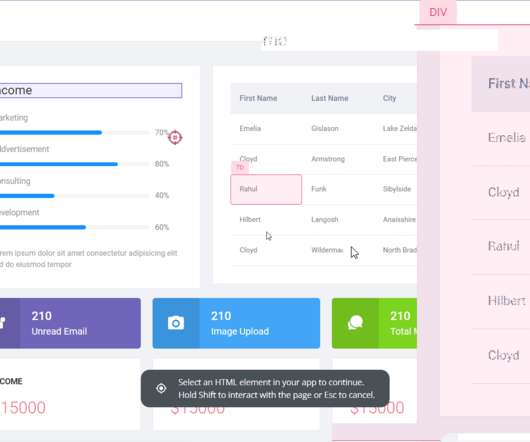
You reach out to all department heads and request to get data for your analysis: Marketing team for data on campaign conversion, customer support for data on call volumes, account team for data on customers feedback, product data for usage, etc. What is a product operations dashboard?
Well, it’s not quite that simple – despite the influx of customer conversations, it can be hard to derive meaningful insights from all that data. Identifying the right insights is key to operating at scale while keeping your customer experience personal, but it’s a huge challenge to find the signal in the noise.
When you’re building a mobile product , data is your lifeline. Whether for tracking feature adoption or spotting drop-off points, the right analyticstool can make or break your growth. Some tools are great for marketers, and others are for product or development teams.
Data can be a powerful tool if you know how to put it to work! Often I start my analytics conference keynote addresses by asking the audience to share the issues they face in their organizations. In fact, this issue is so pervasive in organizations that 80 to 90% of the analysts in the audience report this problem.
Pro Tip: Pair your quick wins with data. A dashboard showing metrics like feature adoption or user engagement amplifies your credibility. Advanced Tactics: Stakeholder Mapping: Use tools like the Stakeholder Alignment Blueprint (available on jonihoadley.com) to identify key goals and concerns. Click here to download.
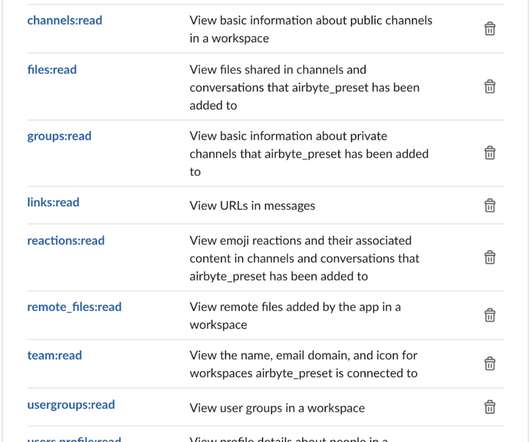
an open-source data integration platform?—?and an open-source data exploration platform?—?in We will use the Airbyte’s Slack connector to get the data off a Slack workspace (we will be using Airbyte’s own Slack workspace for this tutorial). We will save the data onto a PostgreSQL database. and Apache Superset ?—?an
Visualdata surrounds us – colorful charts on weather reports, infographics on the web and in social media articles, map charts in presentations, etc. To help you get started with datavisualization, this article explores various visualization methods and their use cases. Funnel charts. Pie charts.
Tracking user behavior analytics in mobile apps is a whole different challenge compared to the web. Without a global DOM or easy auto-capture tools, tracking mobile app user behavior takes more planning. And the behavioral data you do collect depends on what you choose to track and how you track it. Mobile analytics ?
Web and app analytics are fundamental to business these days. The analytics market is also highly competitive, with providers of all scales and agility fighting to get their three lines of code or SDK into your software. In most cases the answer – I confidently predict – is pretty much nothing. Where’s the Problem?
A product adoption dashboard helps you visualize key adoption metrics so you can make data-driven decisions and boost user engagement. In this article, we cover the following: Why you need a product adoption dashboard. Steps to measure adoption using a comprehensive dashboard. What is a product adoption dashboard?
Reporting vs. analytics – which should you choose for your business? While a growing number of businesses are increasingly adopting reporting and analytics , the difference between both terms can be confusing. Essentially, reports communicate information, while analytics provide context and insight.
Nearly 60% of mobile teams still rely on self-hosted push tools. They trade short-term savings for long-term pain: no analytics, poor timing control, and zero personalization. Of course, poor execution backfires. Use user data (name, location, preferences, past behaviors) to send relevant, personalized notifications.
For more: Lennybot | Podcast | Hire your next product leader | My favorite Maven courses | Swag Subscribe now This post will transform how you build products, come up with new ideas, and operate as a PM. Colin Matthews was a longtime PM and now teaches my favorite AI prototyping course: AI Prototyping for Product Managers.
Established customer relationships and financial product stickiness (customers typically avoid switching to other finance service) lead to high retention rates. high-value customers or frequent purchasers), you can reveal actionable insights about this group of customers. Tracking retention in Google Analytics. New course alert!
What is DataVisualization? More than just making numbers look pretty, datavisualization is the graphical representation of information. Graphs, charts, maps, and tables are powerful communication tools, helping to make data more accessible. Why is DataVisualization important for Product Managers?
The Two-Hour Design Sprint: A Crash Course So, what exactly is a two-hour design sprint? Example: Imagine you’re designing a new dashboard for a fintech app. Example: For our dashboard, we might ask, “How might we create a dashboard that helps analysts quickly spot trends and take action?”
Productside | Product Management Courses & Training Product PickEm 2025: The Ultimate Startup Showdown The biggest showdown in product management is BACK and this time, its all about the most promising startups. You get to vote for the tools you believe in and help crown the final winner via our LinkedIn polls on the Productside page.
But with so many tools in the market, which one should you choose for product analytics ? Unlike sales funnel software, funnel-tracking tools track numerous funnels such as goal completion, conversion , and review funnels. When selecting a funnel tool, look for customization, integrations, segmentations , and dashboard options.
Welcome to Product PickEm 2025 , where the best emerging product tool startups go head-to-head in a bracket-style competition, and YOU decide which ones rise to the top via our LinkedIn polls on the Productside page. Each round, the lowest-scoring tools get eliminated, and the best move forward. Forget the hype. Four winners.
If you are wondering how actionable analytics can help you boost product growth in 2023, this post is for you! In this article, we cover everything about different types of actionable analytics, how to collect those actionable insights and the best tools you can use to harness the analyticaldata.
The “shiny penny” approach (focus all your attention on the hottest tools in the market) or “head in the sand” approach (fall victim to analysis paralysis and avoid choosing any tools) are no longer viable. But here’s the thing: a tool is not a strategy. The anatomy of a marketing tech stack [with recommended tools].
SaaS tools are the industry's biggest open secret. Wondering what type of tools you should have in your stack? TL;DR SaaS tools are applications that users can access through an internet connection. There are different types of SaaS tools for different purposes. ProductPlan is the best tool for road mapping.
We live and work today in a world that is increasingly data-driven, but we cannot successfully adopt a data-driven approach to decision making without first identifying the metrics that matter most. Plus, there’s no shortage of tools to help us quantify seemingly everything. The real issue is lack of focus. In This Article.
I admit Introducing Userpilot Analytics may not be the most accurate title. After all, Userpilot is already a powerful analyticstool and we’re simply adding new features that have been available only in dedicated product analyticstools so far. What can you expect from the new Userpilot analytics?
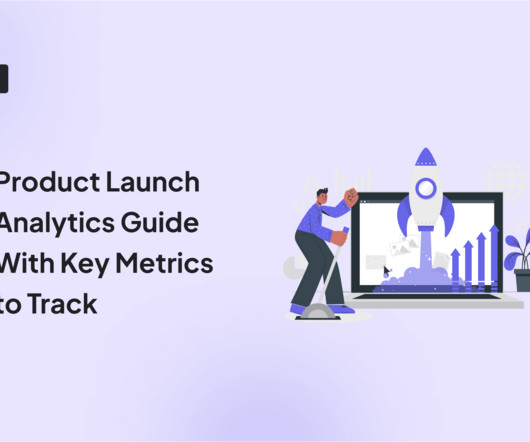
The key is to monitor all the data and optimize your strategy at each step. That’s where product launch analytics step into the picture. In this article, we’ll dig deeper into key metrics and tools to help you get started with product launch analytics. Book a demo to see it in action.
Which of them should you choose to generate growth insights for your product? We also have a quick look at Userpilot as an alternative for each of the tools. TL;DR Product analytics is the process of collecting and analyzing data about product usage and user behavior. What is product analytics? Ready to dive in?
Which product analyticstools should you be using? How many analyticstools do you need? And what type of analytics really matters for a product marketing manager? By the end, you'll know the only type of analyticstools you really need as a PMM. What is product analytics?
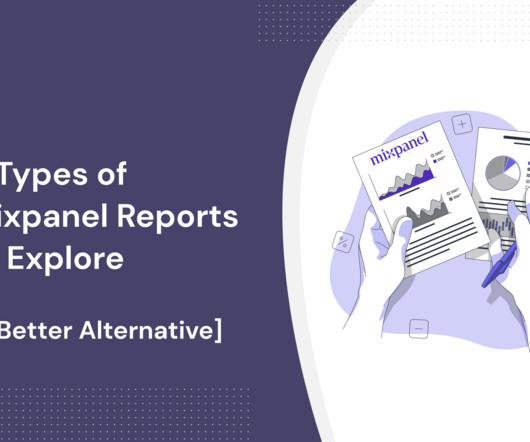
Mixpanel reports help you keep track of key metrics in your product analytics portfolio. That said, there are four different types of reports that you can generate with Mixpanel in just a few clicks. This guide will cover the different types of Mixpanel data! Visualize actionable data from your product or users.
Do you want to learn how to use dataanalytics to improve customer experience? Many SaaS founders agree that customer insights are a key driver of product growth. After all, analyzing customer data can help you identify areas to improve upon and anticipate customer behaviors. Make data-driven decisions.
No product tool or template can save you if you’re not killing it in these three areas. That’s why we’ve listed 12 tools that the best product managers use to do their jobs better? That’s why we’ve listed 12 tools that the best product managers use to do their jobs better?—?and and not the best product management tools.
Reveal Embedded Analytics. Embedded analytics is everywhere around us – in our cars, in our homes, in our security systems, in the digital advertising that we see while surfing the web, and even in the healthcare services we are being treated with. And that is because data nowadays is everything. Especially in business.
Over the course of the past year, the customer support landscape has changed for good. Not only that, but 49% say those interactions are highly complex, and 32% report that there have been more emotional customer support interactions. Challenge #2: Agents are wasting time jumping between tools.
Of course, none of this will work if you dont have the customer reviews to back it up. In fact, 72% of consumers say they only engage with personalized messaging, such as recommendations, messages, and visuals tailored to their behavior. Review your app analytics to identify underused features. Nike is the best example here.
Generating data is easy. Data is often not accessible unless you can write code. People in non-technical roles rely on data every day to make decisions, develop ideas or measure success. When tools and systems are not created with them in mind, they lose trust and understanding. It doesn’t have to be this way.
Finally, you might be wrong and be missing out on potentially important insights because of an unwillingness to understand the person’s reasons. I think a datavisualizationdashboard would be great as a first screen in the back-office.”. Because otherwise users have to go to the reports screen, and they shouldn’t.
If you've searched for this comparison, you're probably looking for a tool that will help you gain actionable insights to drive your product growth. Whether looking for an alternative to your existing tool or setting up product analytics at your organization, we're here to help. Heap vs Pendo?
“We are a data-driven company”. And, while the logic behind a data-driven approach is undeniable, too often the expectations that come with it aren’t met. And, while the logic behind a data-driven approach is undeniable, too often the expectations that come with it aren’t met. Improper Testing.
Seeing a real demand for business courses in their consumer marketplace, the team identified an opening in the market to disrupt corporate training and hypothesized that employers would be more than willing to pay. Just look at the world of marketing: there are now more than 7,000 tools , up from a mere 150 in 2011.
Reveal Embedded Analytics. It’s hard to believe that many organizations in today’s data-driven world are still struggling to make use of the vast amounts of data they possess and that for most, accessing and analyzing data remains a distant goal. The Do’s of Embedding Analytics Into Your Apps.
In the bustling and competitive online beauty scene, Rumi Cosmetiques was struggling with a user experience that felt more like an obstacle course than a seamless shopping spree. Moreover, the product pages were shrouded in ambiguity, not providing the clarity and insightful descriptions necessary for coaxing a credit card out of hibernation.
Amplitude Analytics is one of the most popular digital analyticstools for SaaS businesses. It offers valuable insights into user behavior to drive growth and enhance your user experience. But is Amplitude the right tool for your company? What is Amplitude Analytics? Source: Amplitude.
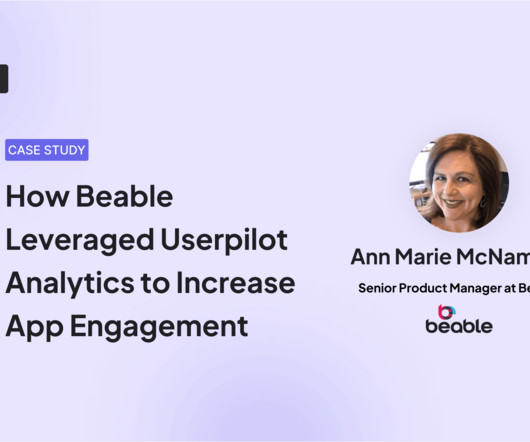
We chatted with Ann Marie McNamara, Beable’s Senior Product Manager, about how the company used Userpilot analytics and feedback features to enhance user experience and engagement. If you’re looking for a robust product growth platform with advanced feedback and analytics features, book the demo! Userpilot solved both problems.
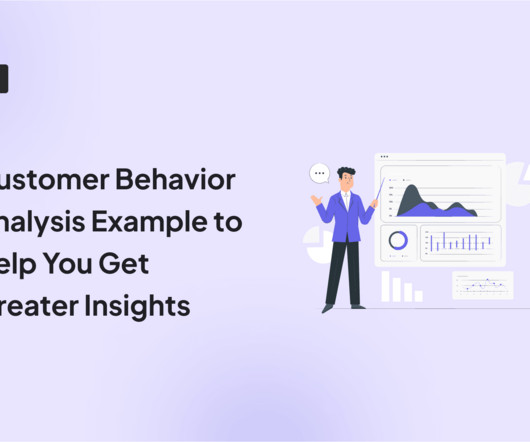
Looking for a customer behavior analysis example to see how you can extract valuable insights? In this article, you will also learn how to conduct customer behavior analysis step-by-step and how Userpilot analytics can help. To gain meaningful insights, the analysis should focus on specific user segments. Here are 3 reasons.
We organize all of the trending information in your field so you don't have to. Join 96,000+ users and stay up to date on the latest articles your peers are reading.
You know about us, now we want to get to know you!
Let's personalize your content
Let's get even more personalized
We recognize your account from another site in our network, please click 'Send Email' below to continue with verifying your account and setting a password.


Let's personalize your content