This site uses cookies to improve your experience. To help us insure we adhere to various privacy regulations, please select your country/region of residence. If you do not select a country, we will assume you are from the United States. Select your Cookie Settings or view our Privacy Policy and Terms of Use.
Cookie Settings
Cookies and similar technologies are used on this website for proper function of the website, for tracking performance analytics and for marketing purposes. We and some of our third-party providers may use cookie data for various purposes. Please review the cookie settings below and choose your preference.
Used for the proper function of the website
Used for monitoring website traffic and interactions
Cookie Settings
Cookies and similar technologies are used on this website for proper function of the website, for tracking performance analytics and for marketing purposes. We and some of our third-party providers may use cookie data for various purposes. Please review the cookie settings below and choose your preference.
Strictly Necessary: Used for the proper function of the website
Performance/Analytics: Used for monitoring website traffic and interactions
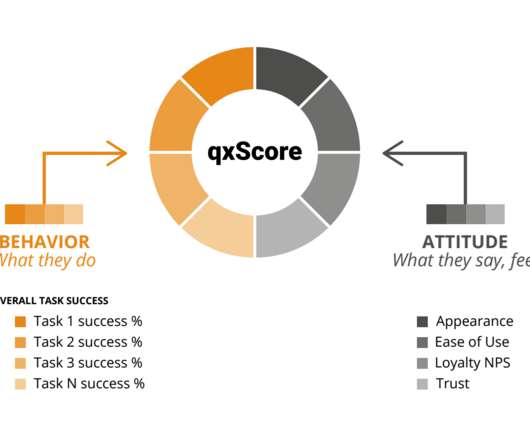
Introduction to customersatisfaction surveys Customersatisfaction surveys are vital tools for understanding what customers think, feel, and experience. This information empowers teams across your company to make informed decisions based on customerexperiences and perceptions.
You can download the free, comprehensive e-guide, here. Surveys, combined with open text analysis, however, hold immense potential for uncovering deeper customer insights from customer feedback. How can we improve the userexperience? At Alchemer, we’ve established that NPS surveys dont tell the full story.
According to a 2024 analysis , on average, over 95% of users who download a new mobile Android app abandon it within the first 30 days. Put simply, app downloads are great but insufficient. Map out the complete user journey Before moving on to the actual engagement strategy, pause to examine your app further.
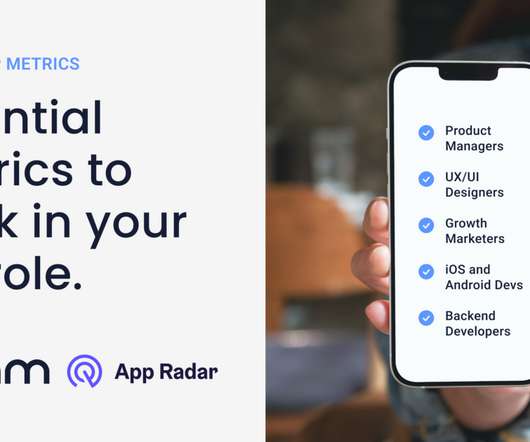
1 Engagement DAU/MAU Understand daily and monthly active user engagement and overall app popularity. 2 Engagement Feature adoption Gauge user interest in new features and optimize feature development. 3 Engagement Average user session length Measure user interactions and identify areas for improved content or flow.
A harmonious blend of UserExperience and Conversion Rate Optimization. While UX is all about creating a delightful customer journey, CRO zeroes in on converting those delightful moments into actual sales. Ready to transform curious clicks into loyal customers? Sound familiar? The solution? Lets getstarted!
Reveal Embedded Analytics The critical role of customersatisfaction in today’s hyper-competitive, data-centric world is unequivocal. It’s not merely an indicator of customer loyalty; it’s an indicator of your business’s trajectory. But in the customersatisfaction area specifically, it does wonders.
One of the big selling points of PWAs is that unlike native apps, they don’t need to be downloaded before use. They work like web pages in that respect, but they also offer functionality like push notifications, speedy caching, and much more to provide a slick userexperience. This happens fast.
To put it differently, if the business goal is wrong, you are likely to determine the wrong opportunities and discover the wrong features and userexperience. You can download the tool together with a handy checklist from my website. It’s garbage in, garbage out. It applies to product discovery in general.
When companies take the time to design products that match what the customer needs, profits soar, customersatisfaction (and retention) soars, and employee satisfaction gets a nice uptick too. Her book, Customers Know You Suck , address how to better understand, attract, and retain customers.
He is Howard Tiersky, author of the Wall Street Journal bestselling book Winning Digital Customers: The Antidote to Irrelevance. He founded FROM, a digital transformation agency, which has won over 100 awards for userexperience design, including for their work redesigning the Avis app which is now ranked by J.D.
Include any bug fixes Inform users about any issues that have been resolved without overwhelming them with technical details. For example, if a bug causes the app to crash when uploading large files, simply communicating the problem and resolution can improve usersatisfaction. What should the release notes template avoid?
So, when looking at these metrics, it shouldn’t be just about your product’s performance or health, it should be about whether your customer is satisfied or not. For example, when considering session length, the simple view is that longer is better, because the customer is more engaged with your application.
By dedicating resources to refine these moments, businesses can enhance conversion rates, drive up sales, and minimize customer turnover. Enhancing Brand Image: Theres a direct link between usersatisfaction and brand perception. These might include boosting sales, expanding into new markets, or improving customer retention.
Vanity metrics are numbers that look impressive but don’t predict user behavior or drive business decisions. These metrics make teams feel good about performance without revealing any insights on what users could do next. Constrain yourself to extremely specific, actionable metrics that can help boost user engagement.
Target customer 2. Userexperience (UX) Write down your hypotheses in each layer then test the product with customers to see where you’re at with product-market fit. 8:38] How do we identify our target customer? Click here to download the Action Guide. Target customer 2. Value proposition 4.
This reduces support costs, improves customersatisfaction, and accelerates the iteration cycle. How user session analysis can turn observations into improvements Understanding user behavior isn’t primarily a technical challenge. They’re not struggling with export functionality.
More than 90% of the downloaded apps are deleted after one use. Similarly, 88% of users don’t return to a website after bad userexperience. For that, they need to be in tune with what the end-user wants and how they can code the interface to offer what’s expected of them. That’s right! This is why UX matters.
Looking for a good customersatisfaction tool and wondering which one of UserGuiding, Userflow, and Stonly is the best option for your SaaS company? There are plenty of tools for customersatisfaction on review sites, but they don’t make the choice any easier. Let’s compare them! Let’s dive in!
The only way to have a fighting chance is by focusing on the userexperience within your mobile app. Try to understand what the in-app user journey is like. Why aren’t app users engaging with it more? And how can you turn them into active users? What is app engagement?
Looking for a good customersatisfaction tool and wondering which one of Pendo, Appcues, and UserGuiding is the best option for your SaaS company? There are plenty of tools for customersatisfaction on review sites, but they don’t make the choice any easier. Let’s compare them! Let’s dive in!
And shows you how to optimize them for better conversions and higher customersatisfaction. TL;DR Customer journey touchpoints are moments or points of contact where customers interact with the product or brand. To identify the key touchpoints, first research customer expectations and needs. Let’s dive in.
Download The Conversational Support Funnel Starter Kit. Internet scale and changing customer expectations are driving and accelerating the change. The userexperience of these tools has never been more important. ” The post Customer Support is being turned upside down. ” Charles Darwin.
Offshore development teams want to create a better userexperience by making interactive, intuitive, and user-friendly mobile apps. Benefits of app development: App development increases the number of users through customer engagement, customersatisfaction, efficiency improvement, etc.
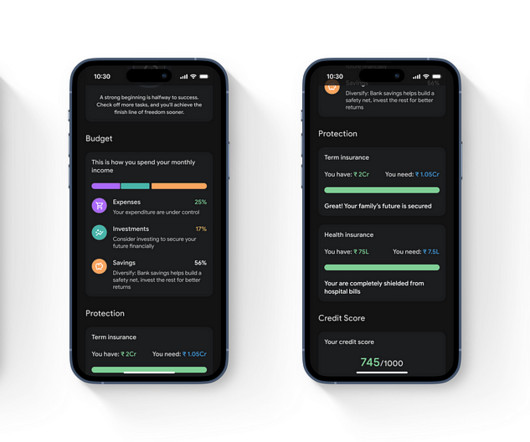
However, for this case study, Instead of developing new applications, integrating financial management features into Google Pay can leverage its large user base for seamless userexperiences. Google Pay, with over a billion downloads, provides a familiar platform for financial transactions. Why Google Pay and Gemini AI?
Want to know how the goals-signals-metrics process can be used to create a better userexperience? Let’s go over how you can effectively use the GSM process to improve your userexperience. Originated at Google, the goals-signals-metrics (GSM) process helps a product team create a smooth userexperience.
Mobile app optimization is the process of improving an apps performance, usability, and engagement to keep users active and reduce churn. It ensures faster load times, intuitive navigation, and a smooth userexperience. A poor experience leads to churn, no matter how great the product is.
A step-by-step walkthrough of the mobile userexperience design process. Mobile UX design is the process of creating efficient and enjoyable userexperiences for mobile websites and apps. Short answer: Providing a seamless mobile experience means tapping into an already existing desire to use platforms on the go.
Though only a handful of apps take most user engagement, there are too many instances of small business apps making up the elite club of successful apps. Once your app is downloaded and installed, it makes your business visible all the time and allows keeping touch with the customers all the time.
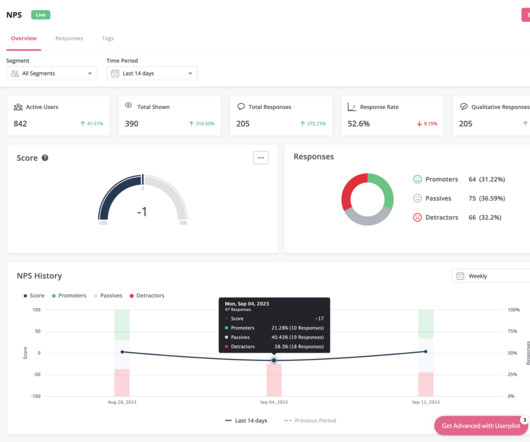
Finally, we’ll discuss how you can use the data to improve your usersatisfaction scores by a) streamlining your onboarding flow to guide users towards the desired behaviour pattern (basically, getting them to reach the ‘AHA moment’ that correlates with high NPS score) and b) – improving your product.
A better, and deeper understanding of your customers and targeted market. Improve UserExperience. Another way in which ISVs can benefit from a strong analytics offering is by bringing insights and data directly into your applications that users are already using and are familiar with. Additional Source of Revenue.
Weekly active users (WAU) and Daily active users (DAU) on the UXCam Dashboard. Downloads App downloads show how many people downloaded your app in a certain period of time. It’s quite a straightforward metric that you need to track to understand what influences the increase or decrease in app downloads.
Customerexperience automation (CXA) refers to any technology you can use to automate, scale, and remove friction from customer interactions. CXA can help you streamline the customerexperience, drive customersatisfaction and improve retention. Drives customersatisfaction.
The Zoho Analytics integration allows you to analyze your customer service activity to evaluate agent performance and track customersatisfaction. Chatdesk Trends automatically tags and identifies patterns in customer feedback from different channels. However, you may still need to pay to subscribe to the products.
Similar to embedded analytics, it becomes an intrinsic part of the application, creating a unified userexperience without discernible separation between the two software solutions. By staying ahead of market trends and user preferences, businesses utilizing OEM analytics can maintain a competitive edge in their industry.
For instance, Instagram has simple yet highly engaging features, such as endless scrolling, user-generated content, and consistent visual appeal, which is why it succeeded compared to apps like MySpace or Friendster. Frequent app crashes: Technical glitches or slow load times disrupt the user journey.
Introduction In today’s fast-paced digital world, creating a product that not only functions well but also delights its users is a significant challenge. Achieving this requires a deep understanding of userexperiences, motivations, and emotions. Objective: To evaluate how easily users can navigate and use a product.
Here’s an exclusive collection of content tackling the number one UX challenge – getting user research into the product development process. This free-to-download bundle contains all the following resources: How to include user research in early product development. Download the library.
Do you want to leverage event data to make data-driven decisions to enhance userexperience? Event data allows you to understand your users’ behaviors and needs on a deeper level. It encompasses a wealth of data like user actions, feature usage, and beyond. Create exit surveys in Userpilot.
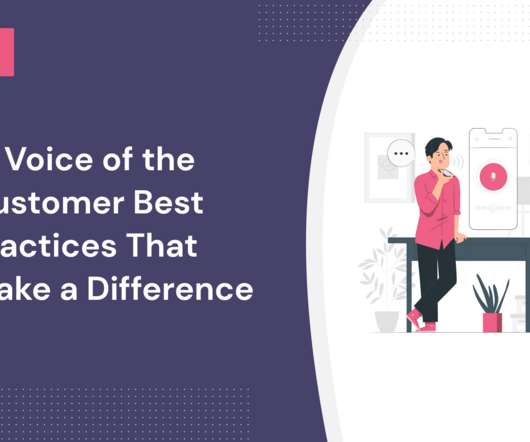
Have you ever wondered how to collect customer feedback efficiently and which voice of the customer best practices to follow? Taking the voice of the customer (VOC) into account is essential when trying to maximize customersatisfaction, improve user sentiment , and get the most out of your marketing efforts.
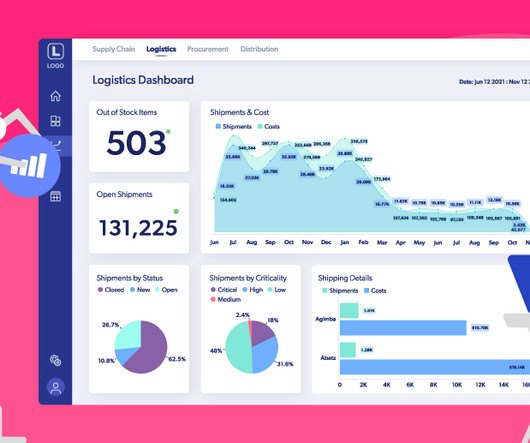
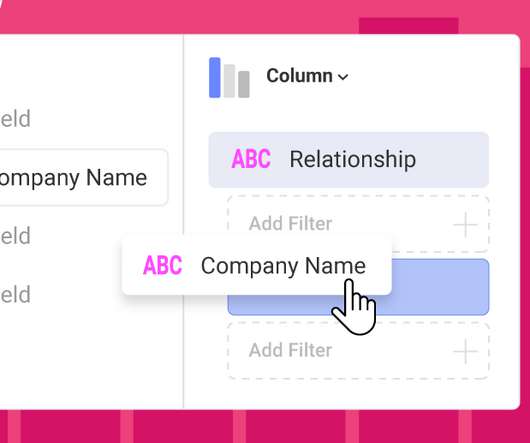
Drag and drop analytics are interactive and user-friendly analytics platforms that allow users to analyze complex data sets and build custom dashboards and reports by themselves when they need them. . See how Reveal’s drag and drop analytics capabilities can let you easily build dashboards and custom reports on your own: .
Whether you own a small health practice, build medical devices, or provide insurance, knowing — and acting on — your data is the key to delivering a great userexperience (UX) and gaining a serious competitive advantage. These two user engagement metrics matter greatly to your business. Customer churn.
Product conversion is the event when users perform any desired action you want them to do on your site or product. The desired action could be: completing a purchase, downloading a trial software or app, using a specific app feature, completing events, etc. User Journey Map. What is product conversion in SaaS?
The customer profile template contains different types of data, including: Product engagement data such as product usage patterns and interactions with different features of the product. User sentiment data regarding the positive and negative emotions the userexperiences while interacting with your brand.
Saas, also known as cloud-based software, is hosted on the cloud so there is no need to download anything. You can do that by calculating different metrics matched to the particular user journey stages. Here is what you can do: Evaluate users’ responses. Follow up on users’ feedback. Customer Effort Score (CES).
We organize all of the trending information in your field so you don't have to. Join 96,000+ users and stay up to date on the latest articles your peers are reading.
You know about us, now we want to get to know you!
Let's personalize your content
Let's get even more personalized
We recognize your account from another site in our network, please click 'Send Email' below to continue with verifying your account and setting a password.


Let's personalize your content