This site uses cookies to improve your experience. To help us insure we adhere to various privacy regulations, please select your country/region of residence. If you do not select a country, we will assume you are from the United States. Select your Cookie Settings or view our Privacy Policy and Terms of Use.
Cookie Settings
Cookies and similar technologies are used on this website for proper function of the website, for tracking performance analytics and for marketing purposes. We and some of our third-party providers may use cookie data for various purposes. Please review the cookie settings below and choose your preference.
Used for the proper function of the website
Used for monitoring website traffic and interactions
Cookie Settings
Cookies and similar technologies are used on this website for proper function of the website, for tracking performance analytics and for marketing purposes. We and some of our third-party providers may use cookie data for various purposes. Please review the cookie settings below and choose your preference.
Strictly Necessary: Used for the proper function of the website
Performance/Analytics: Used for monitoring website traffic and interactions
Reveal Embedded Analytics Today’s business users expect more than static dashboards or delayed reports. That is the promise of self-serviceBI: giving users direct access to the answers they need without relying on data teams or filing support tickets. This is where embedded self-serviceBI comes in.
Reveal Embedded Analytics Your engineering team is shipping fast. But your enterprise BI setup? Most enterprise businessintelligence platforms were never designed for in-app use. They were built for analysts, not developers or product teams. Embedding analytics isn’t an enhancement.
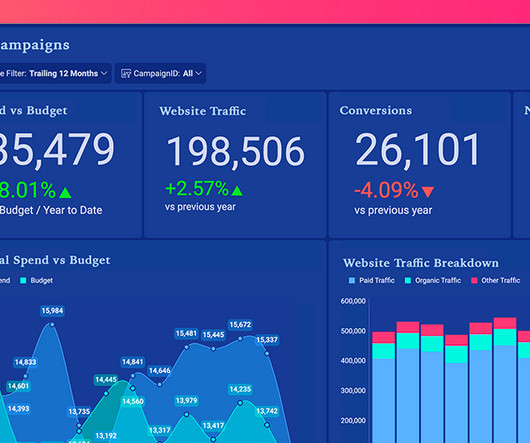
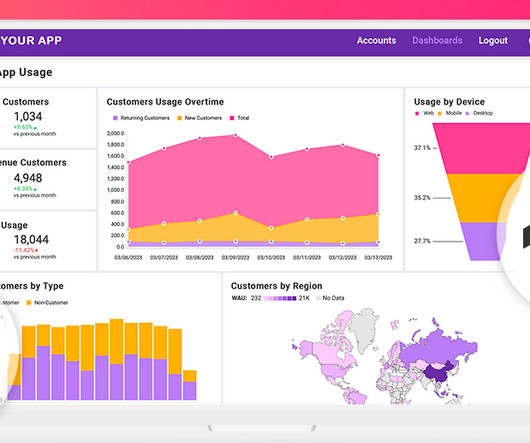
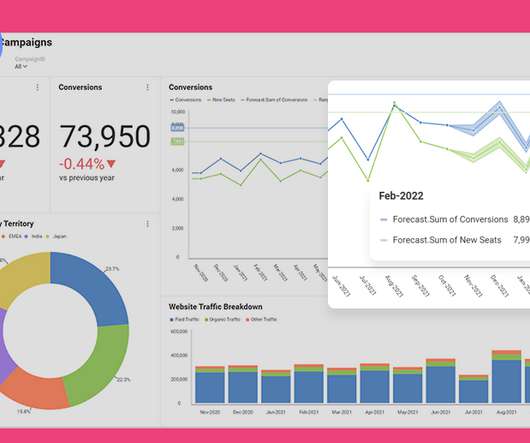
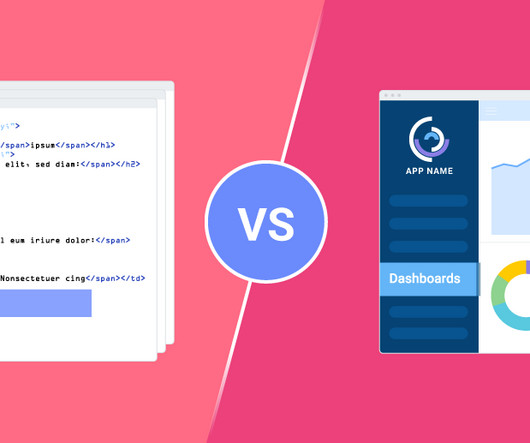
Reveal Embedded Analytics We know how difficult it is to create dashboards, especially for web applications. However, running business operations or targeted campaigns without insights into their effectiveness is not an option. Thats what dashboards are for. It offers several options when it comes to dashboard libraries.
Five years ago, including embedded analytics in an application was a powerful way for product teams to differentiate their applications, reduce customer churn, and charge more for their products. When considering the value of analytics relative to their products overall, survey respondents estimated the value at 54%, up from 45% in 2016.
But today, dashboards and visualizations have become table stakes. Discover which features will differentiate your application and maximize the ROI of your embedded analytics. Brought to you by Logi Analytics. Think your customers will pay more for data visualizations in your application? Five years ago they may have.
Starting a career as a businessintelligence analyst requires understanding the key steps, skills, and experiences needed for success. In this article, we will outline the typical journey for businessintelligence analysts, covering educational requirements, entry-level positions, potential advancements, and long-term opportunities.
Reveal Embedded Analytics Data-driven companies have a hidden advantage! Theyve consistently outperformed their counterparts, reporting significantly higher metrics across operational efficiency (81% vs. 58%) , revenue growth (77% vs. 61%), and employee satisfaction (68% vs. 39%). How is this possible?
Reveal Embedded Analytics Introduction to Embedded Analytics in Angular and.NET Core Embedded analytics is no longer an optional featureits a necessity for modern applications. This guide provides a comprehensive walkthrough of embedding analytics into your software products using Reveal Embedded Analytics.
Reveal Embedded Analytics. Embedded analytics is everywhere around us – in our cars, in our homes, in our security systems, in the digital advertising that we see while surfing the web, and even in the healthcare services we are being treated with. Legacy Infrastructure.
Today, Constellation Research , a leading technology research and advisory firm based in Silicon Valley, announced that Birst, an Infor company, for the fourth consecutive time, has been named to the Constellation ShortList for Cloud-Based BusinessIntelligence and Analytics Platforms.
A strong analytics stack is foundational to being able to make sense of it all. Investing in a robust and efficient analytics stack is a necessity for a modern business in order to compete. It empowers each team across the organization to make data-driven decisions, with access to reporting and ad hoc analysis. .
Reveal Embedded Analytics With abundant data, users have shifted to a data-first approach to guide their decision-making process. Integrating powerful BI with fully interactive visuals and reports into your Blazor applications makes data analytics accessible to all your end-users. And it’s easy to see why.
Reveal Embedded Analytics In today’s data-driven world, integrating dashboards and analytics capabilities directly within SaaS applications is a must. There are many benefits to embedding analytics , including quicker time to market, increased productivity and performance, and growth of profits. We have a Node.js
Reveal Embedded Analytics. By integrating an embedded analytics solution into your own software, SaaS, Angular application , or other apps, you can greatly improve your existing product’s value proposition. . Here, we’re going to cover all of the do’s and don’ts when embedding analytics into your applications. .
This guide will introduce you to the best resources available for businessintelligence analysts, providing you with a curated selection of valuable materials to enhance your skills and knowledge. Consider Userpilot for its engagement features and analytics capabilities. What does a businessintelligence analyst do?
Embed a video in modals with Userpilot. Embed tutorial videos in your resource center for self-serve support Integrate videos to an in-app hub so that users can find answers when they need them. For example, Userpilot’s resource center enables you to embed videos that provide visualized assistance. But how do you start?
Embarking on a career as a businessintelligence analyst involves a combination of education, skills development, and practical experience. This guide will provide you with a comprehensive overview of the path to becoming a successful businessintelligence analyst. Let’s dive in!
Key Tasks User issues reports. Identify key quality metrics and create dashboards to track real-time product health. Identify measures of success, create dashboards for tracking, and report on progress to ensure team’s know whether or not they’re hitting the mark. Product Development Specialist (PDS). Bug triage.
Reveal Embedded Analytics. Embedding analytics into your Angular apps is a tremendous advantage for your business; it helps you gain valuable business insights from your data and grow your profits by guiding key business decisions. What Is BI? Why Should Your EmbedBI in Your Angular Apps?
Reveal Embedded Analytics. Choosing the right embedded analytics solution to partner with is crucial. Nowadays, it is quite evident that businesses’ success heavily relies on data insights that embedded analytics software can provide them with. Table of contents: What is Power BI embedded?
Reveal Embedded Analytics. Businesses of all industries and all sizes incorporate embedded analytics technologies and capabilities into their own software, SaaS platforms, Angular apps , or other apps because of the tremendous benefits that they get. See Reveal in Action. CRM: Maximize customer lifetime value.
Reveal Embedded Analytics. Among all embedded analytics products on the market, Tableau is certainly one of the most popular BI tools for analyzing, visualizing, and working with data. Tableau has been helping businesses to transform raw data into valuable insights for more than 16 years.
By analyzing user behavior patterns and uncovering valuable insights, behavior analytics tools enable businesses to design strategies that drive retention and business growth. Discover the cutting-edge of behavioral analytics tools! Behavior analytics tools empower companies to make effective, data-driven decisions.
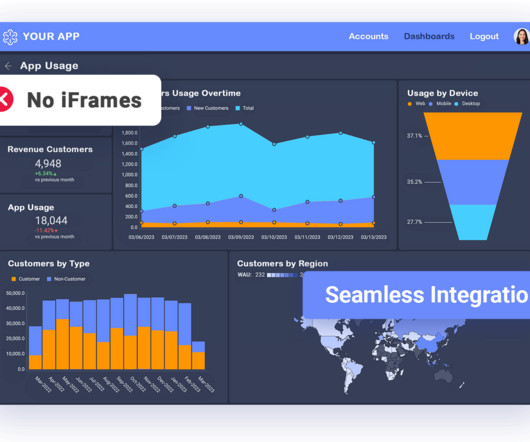
Reveal Embedded Analytics Integration is the most important thing to consider when choosing an embedded analytics vendor to partner with. When analytics into an existing application, the user experience, workflows, and branding must flow seamlessly without adding complexity or confusion to your customers.
A robust survey platform should be able to automate data collection, ensure data quality, and integrate results into your existing workflows or analytics platforms, making insights more actionable. Analytical Surveys: Analytical surveys go a step further, aiming to understand the “why.”
As a fellow PMM who’s been there, I can tell you that traditional analytics tools just don’t cut it anymore. That’s where Userpilot’s mobile analytics come in. The platform’s code-free implementation makes it accessible for product managers who want insights without constantly relying on developers.
Reveal Embedded Analytics. Logi Analytics is one of the first white-labeled/OEM embedded analytics providers for small-to-medium-sized businesses. But is Logi Analytics the right embedded analytics solution for your organization? Logi Analytics Overview. The Pros of Logi Analytics.
Reveal Embedded Analytics. Looking for an alternative to Sisense embedded analytics platform? Reveal has been rated as one of the highest performing embedded analytics solutions on the market based on customer satisfaction ratings. One of the biggest advantages of Sisense is the innovative in-chip analytics in the cloud.
Userpilot is a no-code digital adoption platform that unifies mobile and web engagement, analytics, and feedback. In other words, you can set factors, from design elements like fonts and colors, to targeting conditions, all without developer support. It lacks built-in mobile analytics and uses desktop-style UI components.
Reveal Embedded Analytics Reveal is an industry-leading embedded analytics solution that aims to provide ease of use for integrating powerful analytics capabilities into applications. Making Reveal accessible to all types of business users, regardless of their experience and expertise, has always been our priority.
Product Fruits for user analytics Product Fruits has minimal analytics features. For more detailed analytics, you’ll need the 2-way integration with third-party analytics tools like Mixpanel or HubSpot, which allows you to share and receive data. Basic analytics. No AI-based user sentiment analytics.
It relied on office productivity software and piggybacked on product development tools such as issue tracking software to cobble together what they needed. But what exactly is a product operations dashboard? What is a Product Ops Dashboard? A product operations dashboard provides a visual way to track a subset of KPIs.
Create comprehensive self-service resources to enable users to solve problems independently. Use predictive analytics to identify and proactively address potential churn risks. Create a customer retention analyticsdashboard to measure success across key metrics. The solution? This includes churn prevention.
Reveal Embedded Analytics. This is where tools such as Reveal and Looker come in handy – they convert raw data into easy-to-understand and easy-to-use insights that enable organizations to reshape and modernize the way they do business. A good embedded analytics solution offers a lot more than data visualizations.
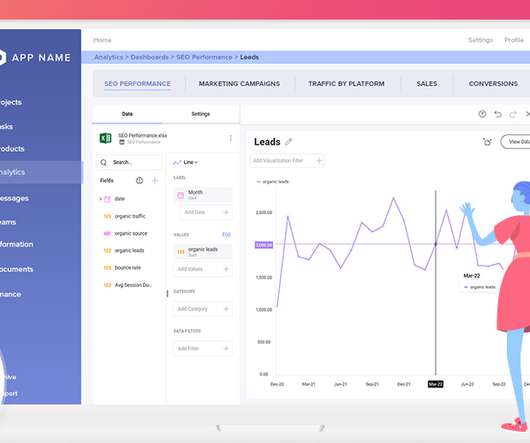
What’s digital analytics? In this article, we also look at different kinds of digital analytics data, how to implement a digital analytics strategy, and the best tools to help you do it! TL;DR Digital analytics allows teams to measure and analyze product performance to improve their digital strategy. Are you in?
Looking for a good selfservice support tool and wondering which one of Pendo, Appcues, and UserGuiding is the best option for your SaaS company? There are plenty of tools for selfservice support on review sites, but they don’t make the choice any easier. Let’s compare them! Let’s dive in!
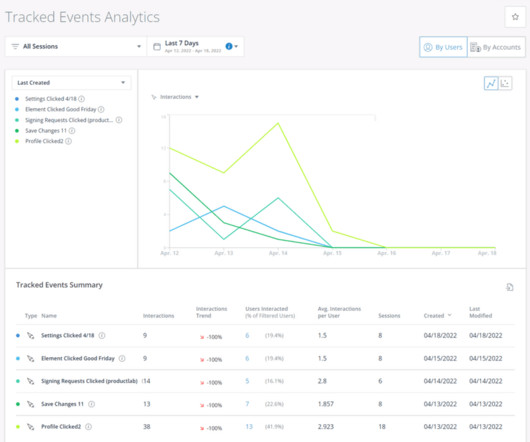
WalkMe supports analytics features such as Tracked Events, Session Streams, User Recordings, and AI Predictive Analysis to gain actionable insights into user in-app behavior. Userpilot is an alternative product adoption platform with better analytics and feedback features. The relevant features include: Management dashboards.
Reveal Embedded Analytics. As a business owner or manager, it’s natural to want your business to run smoothly and efficiently. When it comes to embedded analytics a lot of business owners and managers use white labeling software that helps them build trustful and loyal relationships with their valuable customers.
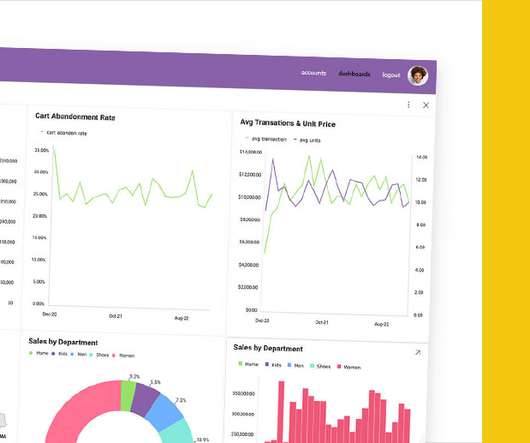
Additionally, good tools allow you to visualize data through different dashboards, charts, or graphs. A good customer success tool allows businesses to create segments based on shared customer attributes (demographic, OS system, returning customer, etc.) Userpilot’s analyticsdashboard. Customer segmentation.
Visual data surrounds us – colorful charts on weather reports, infographics on the web and in social media articles, map charts in presentations, etc. Userpilot helps you generate product usage reports using various dashboards, charts, and graphs. A Gantt chart showing a feature development timeline and process.
Using smart links, you can embed live data from multiple applications to the project pages in Atlas. According to Okta’s Business at Work report, companies with more than 2,000 employees deploy an average of 187 apps. Atlassian Data Lake will simplify custom dashboards, reporting, and analysis. New Editor Feature.
Throughout product development, it may feel like you take two steps forward and three steps back. So in order to get that shiny new feature to market faster than your competitors, your team may take development shortcuts to get it released sooner rather than later – and deal with the necessary coding after the fact. Human error.
TL;DR Pendo Engage is a product adoption platform for with in-app guidance , product analytics, and feedback collection capabilities. The benefits of using Pendo Engage include its custom themes, flexible dashboards , multi-platform analytics, 50+ integrations, and the fact that you don't need to write any code to utilize its features.
Another way to make the sales process more PLG is by adding self-service elements wherever it’s possible, like a resource center for after-hours support. Using analytics tools like funnel and paths analysis or session recordings helps teams identify friction. Leah Tharin: PLG for enterprise and complex products.
We organize all of the trending information in your field so you don't have to. Join 96,000+ users and stay up to date on the latest articles your peers are reading.
You know about us, now we want to get to know you!
Let's personalize your content
Let's get even more personalized
We recognize your account from another site in our network, please click 'Send Email' below to continue with verifying your account and setting a password.


Let's personalize your content