This site uses cookies to improve your experience. To help us insure we adhere to various privacy regulations, please select your country/region of residence. If you do not select a country, we will assume you are from the United States. Select your Cookie Settings or view our Privacy Policy and Terms of Use.
Cookie Settings
Cookies and similar technologies are used on this website for proper function of the website, for tracking performance analytics and for marketing purposes. We and some of our third-party providers may use cookie data for various purposes. Please review the cookie settings below and choose your preference.
Used for the proper function of the website
Used for monitoring website traffic and interactions
Cookie Settings
Cookies and similar technologies are used on this website for proper function of the website, for tracking performance analytics and for marketing purposes. We and some of our third-party providers may use cookie data for various purposes. Please review the cookie settings below and choose your preference.
Strictly Necessary: Used for the proper function of the website
Performance/Analytics: Used for monitoring website traffic and interactions
With an abundance of product analytics to track, having a robust SaaS KPIdashboard is essential to monitor the metrics that matter most. This guide will walk you through what it is, why you need one, and how to build your very own dashboard. What is a SaaS KPIdashboard? Let’s get into it!
Tracking mobile app performance metrics can feel daunting. One look at your mobile app analytics dashboard, and you just want to shut your eyes and scream in frustration. But you find yourself puzzled, overwhelmed, and uncertain about which metrics truly matter. Will this metric help me identify a problem?
So, how do you get started with product analytics ? In this article, we’ll talk about: What product analytics is and why you need a solid strategy. Key steps to build and improve your product analytics strategy. How to apply actionable metrics to different SaaS business stages. What is product analytics?
In SaaS, a customer onboardingdashboard can become a massive product analytics tool to understand and optimize the user journey. But what type of dashboards can you use to analyze your onboarding process? Let’s explore how a customer onboardingdashboard works and see different examples.
Think of Net Promoter Score (NPS) software as a tool to measure your customers’ feelings about your product, and categorize them based on their level of loyalty (promoters, neutrals, and detractors). 1 Userpilot for product teams to collect and act on NPS data Creating NPS surveys with Userpilot.
When you think of Whatfix, your mind probably goes to a digital adoption or an employee onboarding platform. Product teams can use a no-code editor to design step-by-step guidance and interactive elements that live directly inside their mobile apps. The question is: Can Whatfix mobile give you what youre looking for? moment faster.
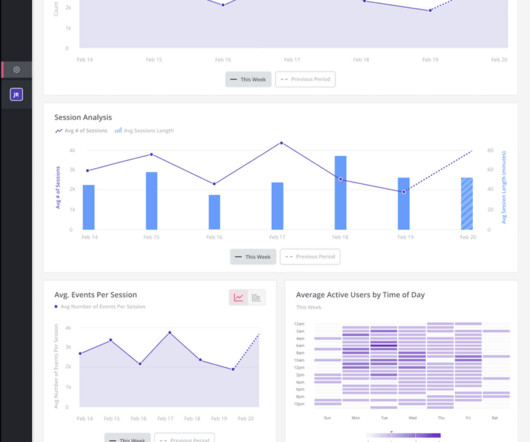
In SaaS, a new user activation dashboard can become a massive product analytics tool to understand and optimize the user journey. But how can a dashboard for user activation can help you engage more users? Weekly New Sign-ups : Offers a granular view of user acquisition trends, allowing you to react quickly to fluctuations.
You see, although we work hard to make Userpilot the best product adoption tool on the market, we know it isnt the perfect fit for every business. Helping prospects find the right product is a win-win situation. Userpilots key features include: No-code Chrome extension for building in-app flows. Pendo The dashboard on Pendo.
Collect customer data to calculate complex formulas for tracking metrics, monitor customer health scores, and resolve support tickets while continuously trying to improve retention and expansion. Consider specific features : Your goals and improvement areas will determine the features you need.
When your company adopts multiple SaaS solutions to drive productivity, you unknowingly create a perfect storm for data fragmentation. Your customer information lives in Salesforce, while your support tickets are in Zendesk, your product usage data in Mixpanel, and your marketing campaigns in HubSpot. Which features need attention?
Poor performance includes slow loading times, complex design, confusing navigation, and unresponsive features. This article will help reduce such churn by refining your product management and UX analysis approach. UX analytics involves gathering, analyzing, and interpreting data about how users interact with your product or service.
Its not just the design, features, or marketing. I mean what happens after the download: how users navigate, what features they engage with, and where they drop off. Mobile app tracking captures data on how users interact with your app, including actions such as screen views, button taps, session length, and feature usage.
When it comes to KPIs vs metrics, which one should you measure to get better insights? What about metrics and measures? Metrics and KPIs are often used interchangeably, but they also have differences. The more you understand these nuances, the better you can evaluate your product growth strategy.
This leads to errors like sending a product update notification at 1 AM or showing the wrong message to the wrong user segment. With push notification marketing, you can nudge a user who just abandoned their cart, bring someone back to continue their onboarding flow , or announce a new feature to your power users while its still hot.
A product adoption dashboard helps you visualize key adoption metrics so you can make data-driven decisions and boost user engagement. In this article, we cover the following: Why you need a product adoption dashboard. Steps to measure adoption using a comprehensive dashboard. Define your main objectives.
When it comes to product management, you need to look at different SaaS dashboard examples to see what kind of product analytics you can measure, and how. So what are the most important types of dashboards and which ones are the best for you? Example of NPS dashboard in Userpilot.
Would you like to learn how to design a SaaS metricsdashboard for your team without any coding? In the article, you will find examples of various SaaS dashboards and learn how to create them with Userpilot analytics. We also explain what metrics you may want to track and how to use the insights they offer.
This is where these 10 key mobile app engagement metrics come in, helping track user behavior and preferences to answer all these questions and boost user activation. What are app engagement metrics? App engagement metrics provide quantitative insights into user interactions with your app. What is app engagement?
With the release of Product Tours , our new feature for building interactive guided flows, all the critical capabilities you need for onboarding new users are now available in a single platform, Intercom. How to choose the onboarding tools you need (and avoid tool overload). How about videos?
A customer expansion strategy is a playbook for increasing the revenue from your existing customers, for example, by selling them additional products and services or encouraging them to upgrade to higher plans. This metric helps SaaS companies track the effectiveness of their expansion efforts. What metrics should you consider?
As you’re researching dashboard reporting tools, you’ve probably noticed how hard it is to find reliable information on the available solutions. To make your life a little bit easier and help you choose the best dashboard analytics tool for your SaaS, we’ve produced a guide of 12 excellent platforms available on the market in 2024.
Wondering how to build a customer success dashboard for your team? From the article, you will learn what a customer success dashboard is, why you need it, and what metrics it should include. And how to build a dashboard for your customer success team using Userpilot analytics ! Why does your team need a CS dashboard?
When you’re building a mobile product , data is your lifeline. Whether for tracking feature adoption or spotting drop-off points, the right analytics tool can make or break your growth. Some tools are great for marketers, and others are for product or development teams. Here are a few that I think do that well. #1
A product analytics dashboard helps you visualize user behavior, so you can make informed decisions on how to improve product engagement. In this article, we cover the following: Why you need an analytics dashboard. The types of metrics to track in your dashboard. What is an analytics dashboard?
It’s no secret that learning how to evaluate product performance is essential for product management. But how can you effectively measure productmetrics that can help you reach your goals and increase revenue growth? Why not book a Userpilot demo to see how you can analyze and improve product performance continuously?
Are you wondering how the new Userpilot custom analytics dashboards can help you drive product growth? In this article, you will learn about the main benefits of custom product analytics dashboards and how to create them in Userpilot. They were an excellent aid to product teams trying to optimize these metrics.
Product marketing metrics are key for understanding and optimizing the performance of your product. They help you measure success, identify areas for improvement, and align your product management strategies with your overall business goals. Time-to-value : Tracks how quickly users realize the value of the product.
Whether you’re introducing a new product, releasing an upgrade, or announcing advanced features, outlining a product launch strategy can help align your efforts in the right direction. That’s where product launch analytics step into the picture. The key is to monitor all the data and optimize your strategy at each step.
If youve ever tried evaluating product tour tools, you know the surface-level comparisons dont tell you much. Every tool claims to be a no-code tool and easy to use, but few support the workflows product teams care about, like multi-step onboarding , flow targeting, mobile support, or analytics that go beyond step views.
Leveraging product analytics isnt just about making pretty dashboards; its about viewing your existing data as a learning opportunity to make informed decisions with your onboarding strategy. Start with your core business goals and map out 3-5 key metrics that directly support these objectives. How to solve this issue?
What happens when you build a product or service around what you think potential customers want, only for them to buy something else? But worse than that, it leads to lower revenue, failed products, and plummeting customer loyalty. Does customer research help build better products? The short answer: yes.
By combining contextual insights from session replays , heatmaps, and behavior analytics, user session analysis helps you interpret metrics through the lens of real user journeys. Imagine a product team celebrating a 200% spike in sign-ups after a promotional campaign. On the surface, it looks like a win.
Are you tracking SaaS metrics without knowing how to make the analytics process easier? Analytics dashboards are visualization tools that give you an overview of key metrics. In this article, we’ll discuss 10 analytics dashboard examples. TL;DR Analytics dashboards are tools for visualizing key metrics in your business.
You know your product collects tons of data. Because product analytics should be easy and accessible for everyone, not just data experts. In this guide, well break down the top data visualization tools for product teams, so you can stop guessing and start making smarter, data-driven decisions. What are data visualization tools?
” And that’s also why AARRR metrics are called pirate metrics. Short for acquisition, activation, retention, referral, and revenue, these metrics help you measure and drive product growth. In this article, we’ll dig deeper into the AARRR framework and the relevant metrics associated with each stage.
It’s crucial to stay updated with the latest trends in customer analytics to better understand customers and make the most out of collected data! So, let’s see 8 critical trends you can follow to stay on track with the changes and how you can apply them to achieve product growth. Why should you analyze customer data?
It offers 8 products that help companies recruit staff, manage payroll and benefits, improve communications, and build workplace communities. The company realized their current onboarding solutions weren’t adequate, so they decided to give Userpilot a go. The product is expensive. Want to learn more? Book a demo!
Want to track the different types of productmetrics to get product growth insights ? Productmetrics are critical for product growth managers to develop the right product strategies and drive continuous value for customers. You can also use a productmetrics framework, ie.
The different reports can offer a variety of insights that help manage your product in the right direction. You just need to ensure you can get started correctly and the metrics you should report on to get the critical metrics. TL;DR SaaS reporting helps to track key metrics and inform the right decisions backed up with data.
Most product analytics tools make tracking user activity on web applications look easy, and it is. Open up a webpage, drop in a script, and boom: clicks, scrolls, and form inputs start flowing into your dashboard without writing a single line of code. You want your tracking to be anchored around real product goals and success metrics.
A customer sentiment dashboard is a great way to visualize customer feedback and see what users love (or hate) about your product. TL;DR A sentiment analysis dashboard typically integrates information from multiple data sources, such as social media posts, customer reviews, survey responses , and customer service chats.
The right customer analytics platform helps you uncover exactly how customers interact with your product: so you can spot issues early, optimize user journeys, and drive sustainable growth. With a reliable analytics solution , you wont miss critical signals or overlook game-changing insights that could increase product adoption.
Researching customer onboarding strategies for your SaaS product? The article shares 17 tried-and-tested customer onboarding tactics that will help you build delightful user experiences and drive product growth. Create a welcome series of in-app and email messages to greet users and kick off onboarding.
Analytics vs metrics – how do they differ from each other? Though both are important, analytics and metrics have distinct meanings and purposes in your data analytics process. Understanding the nuances between them is critical to utilize them to improve your feature adoption , customer behavior, etc.
We organize all of the trending information in your field so you don't have to. Join 96,000+ users and stay up to date on the latest articles your peers are reading.
You know about us, now we want to get to know you!
Let's personalize your content
Let's get even more personalized
We recognize your account from another site in our network, please click 'Send Email' below to continue with verifying your account and setting a password.


Let's personalize your content