This site uses cookies to improve your experience. To help us insure we adhere to various privacy regulations, please select your country/region of residence. If you do not select a country, we will assume you are from the United States. Select your Cookie Settings or view our Privacy Policy and Terms of Use.
Cookie Settings
Cookies and similar technologies are used on this website for proper function of the website, for tracking performance analytics and for marketing purposes. We and some of our third-party providers may use cookie data for various purposes. Please review the cookie settings below and choose your preference.
Used for the proper function of the website
Used for monitoring website traffic and interactions
Cookie Settings
Cookies and similar technologies are used on this website for proper function of the website, for tracking performance analytics and for marketing purposes. We and some of our third-party providers may use cookie data for various purposes. Please review the cookie settings below and choose your preference.
Strictly Necessary: Used for the proper function of the website
Performance/Analytics: Used for monitoring website traffic and interactions
How Rumi Cosmetiques Boosted UserExperience and Conversion Rates in eCommerce: A Case Study for Marketers andManagers Discover how Rumi Cosmetiques achieved a 75% increase in cart adds and doubled conversion rates by enhancing userexperience and conversion rate in eCommerce.
This grouping provides valuable insights into overall customer satisfaction and sentiment trends over time. Website feedback and online surveys : These collect opinions about digital experiences, focusing on usability and content quality. For example, tracking CSAT over time can reveal trends in customer sentiment.
Personalize surveys by setting conditions based on user behaviors , translating and localizing your NPS surveys using AI, and customizing the appearance of your surveys to match your app’s design. Get real-time insights into your survey responses, with visual breakdowns of data, NPS score, and trends.
Fixed Lines for Charts: Set static reference points to highlight key data trends. Flexible Chart Legend Positioning: Move and align legends for better dashboard design. is Here: Smarter Analytics, More Control, Better UserExperience and written by Casey McGuigan. Request a Demo Originally from Reveal 1.7.3
But today, dashboards and visualizations have become table stakes. Think your customers will pay more for data visualizations in your application? Five years ago they may have. Discover which features will differentiate your application and maximize the ROI of your embedded analytics. Brought to you by Logi Analytics.
Unfortunately, the research backs this up, with a staggering 90% of users reporting that they stopped using an app due to poor performance. Basically, anything that ruins the userexperience. UX analytics involves gathering, analyzing, and interpreting data about how users interact with your product or service.
When it comes to product management, you need to look at different SaaS dashboard examples to see what kind of product analytics you can measure, and how. So what are the most important types of dashboards and which ones are the best for you? A SaaS (software-as-a-service) dashboard is a centralized interface within your app.
A product analytics strategy is essential for any business looking to make informed decisions about product development and userexperience. Plus, there are many reasons why you need a product analytics strategy: Aligns product development with user needs and business goals. Why should you have a product analytics strategy?
Variety of UI patterns to engage users, including modals , tooltips , and slideouts. A/B and multivariate testing for optimizing userexperiences. Custom dashboards to track key metrics at a glance. Analytics reports like paths, funnels, and cohort tables for visualizing user behavior data. UserGuiding dashboard.
A customer sentiment dashboard is a great way to visualize customer feedback and see what users love (or hate) about your product. TL;DR A sentiment analysis dashboard typically integrates information from multiple data sources, such as social media posts, customer reviews, survey responses , and customer service chats.
In SaaS, a new user activation dashboard can become a massive product analytics tool to understand and optimize the user journey. But how can a dashboard for user activation can help you engage more users? moment ," impacting user retention and satisfaction.
Userexperience analytics is one of the secret ingredients for boosting SaaS growth. This ensures your product remains enjoyable for users, boosting retention and loyalty. This data type identifies the “what” of a userexperience problem. What is userexperience analytics? across the customer journey.
Get to Know Your User (30 minutes) First things first – who are you solving for? This step is all about understanding who your user is. Example: Imagine you’re designing a new dashboard for a fintech app. ” Perhaps users are spending a lot of time on manual tasks. Big difference, right? Big difference, right?
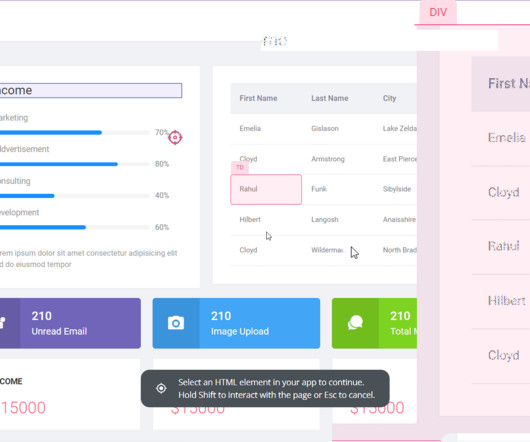
Userpilot’s Visual Labeler enables you to track in-app user behavior, such as clicks, text input, and form submissions, code-free and with no interference from your dev team. With the product usage dashboard, you can track user engagement metrics, popular pages and features, top interactions, trends, and even browser preferences.
When data collection is messy, product managers lose visibility, teams waste hours chasing answers, and userexperience suffers. Based on your current dashboard, it looks like most users churn before completing onboarding. But that view only reflects web users. Products can be prioritized based on support trends.
Choose UX research tools with essential features , collaboration, reliable support , user-friendliness, scalability , integrations , and strong security. Userpilot enhances userexperience through in-depth UX research, offering features to gather, analyze, and act on customer feedback.
Would you like to learn how to design a SaaS metrics dashboard for your team without any coding? In the article, you will find examples of various SaaS dashboards and learn how to create them with Userpilot analytics. If so, you're in the right place! Let's dive in, shall we? Let's dive in, shall we? To name just a few.
Customer analytics is the cornerstone for making informed decisions, enhancing the userexperience, and, ultimately, fostering growth. It’s crucial to stay updated with the latest trends in customer analytics to better understand customers and make the most out of collected data! Why should you analyze customer data?
A product adoption dashboard helps you visualize key adoption metrics so you can make data-driven decisions and boost user engagement. In this article, we cover the following: Why you need a product adoption dashboard. Steps to measure adoption using a comprehensive dashboard. Understand how users adopt new features.
Problem Brief Over a span of 4 weeks, we tested Civians platform and created design solutions to improve the overall userexperience of the dashboard. We also encouraged them to think out loud while they were navigating the dashboard, to help us uncover their mental model and identify hidden insights.
By Mary Moore, copywriter at Shakuro Icons are the unsung heroes of user interfaces, silently guiding users through their digital journeys, and forging connections between your brand and your audience. So, if you’re ready to embark on a journey that promises to redefine your user interfaces, and capture your users’ hearts, read on.
Mobile app tracking captures data on how users interact with your app, including actions such as screen views, button taps, session length, and feature usage. For example, say a user opens your app, skips the onboarding tutorial , and heads straight to the dashboard. Only to lose interest and leave without using any key feature.
A user activity trend can provide key insights into changing user behavior and help you increase conversion rates and product engagement. In this article, we’ll dig deeper into what user activity trends are and outline the key tips to monitor them. We’ll also discuss a few useful tools to analyze user activity.
This powerful tool allows you to see your website or web app through your users’ eyes. It reveals the “why” behind their actions and unlocks valuable insights to improve the userexperience. Conversely, session replays don’t actually record a user’s screen in the traditional sense.
What UX trends are shaping the SaaS industry in 2022? With the rapid growth of technology, each year brings with it new trends. A UX design trend occurs as a result of a change in user behavior or the adoption of new technologies. UX design trends keep UX designers informed and help them understand the market direction.
One look at your mobile app analytics dashboard, and you just want to shut your eyes and scream in frustration. You aim to extract meaningful insights to improve app performance and user engagement. Validating one with the other gives you the whole picture and confidence to make decisions that improve usersexperience.
Staying ahead of emerging IT trends is non-negotiable if you want to maintain an edge. This article covers the 14 key IT trends set to shape the business world. AI-Powered Automation At the top of our comprehensive list of IT trends in 2025 is the use of AI to automate tasks.
Usability testing: Observe users as they interact with your product to identify usability issues and collect feedback on userexperience. E.g., Identify navigation issues in your analytics dashboard based on real-time user interactions. For example, are you trying to validate a new product idea ?
Let’s check out 11 predictions on product management trends in 2024. This will include the use of predictive analytics to forecast user behavior trends. 11 product management trends and predictions for 2024 What trends should product teams look out for in 2024 ? And what challenges will they face?
Instead of guessing what users need, youll have concrete data on which features work, and which dont. Increased User Retention: Understanding user behavior allows you to personalize the userexperience, keeping them engaged for longer. Improve product performance by fixing issues before they affect users.
If you’re a UX designer or product manager wondering how to deliver a better product in terms of usability and userexperience, this is the article for you. Start improving userexperience and usability with user research. How do usability and userexperience differ? Let’s get right to it!
In SaaS, the top data analytics trends can either be a revolution or just fluff. So what are the trends in the data analytics landscape that are actually important for product management ? Plus, analytics allows companies to unlock new growth opportunities, enhance user satisfaction , and ultimately, increase revenue.
Companies already using Whatfix for web For teams already leveraging Whatfix on desktop, extending that functionality to mobile ensures a consistent userexperience across platforms. With a shared dashboard and content strategy, you can manage flows, tooltips, and updates without duplicating effort.
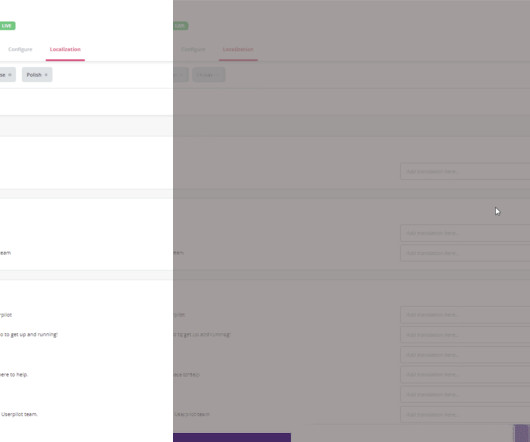
Inefficient dashboard configuration Traders often leverage dashboards to monitor data from personal accounts, control transactions and contracts, follow the latest currency market trends and shifts. To increase working efficiency, users can tweak dashboards and choose the most topical tabs. for Australia and Japan.
This resource allocation reflects a fundamental truth: understanding and optimizing the current userexperience often yields more substantial results than the constant introduction of new, unvalidated features. Tools like click tracking and funnel analysis help pinpoint where users encounter difficulties during onboarding.
Factors I consider when evaluating customer analytics tools Important core features Analytics dashboards : Provide real-time visualizations of key performance indicators (like active users and page views) at a glance, so you can easily track changes. Example of a Userpilot dashboard showing free trial to paid user conversion rate.
UX deals with a user's interactions with specific aspects of your product, while CX is broader and covers all customer engagements with your brand. TL;DR The userexperience (UX) is the sum of a user's thoughts, impressions, and feelings as they interact with specific aspects of your product.
Userexperience can make or break a web app. If your software is slow or buggy, users wont stick around for long. If youre only finding out about these issues after users complain, youre already too late. Autocapture events dashboard in Userpilot. Build and view custom dashboards in Userpilot.
Instead of sifting through endless data, teams can create bar charts to compare metrics or line charts to track trends over time and spot patterns quickly. The goal is simple: make data easy to understand and improve userexperience quickly. Pricing starts at $30/user/month, with a free trial available.
What are the main customer onboarding trends to watch out for in 2023? TL;DR Users interact with the product across different channels, so make sure to provide consistent experiences and messaging at all touchpoints. Want to see how Userpilot helps teams deliver outstanding onboarding experiences in 2023? Book the demo!
Well, you hit two birds with one stone, significantly enhancing both the userexperience and the overall effectiveness of the learningprocess. Here are some key advantages: Improved user engagement: A well-designed application captures users attention and keeps them engaged.
Embedded analytics solves these pain points by providing insights directly within your application, allowing sales teams to track performance metrics in their CRM and operations teams to monitor workflows through embedded dashboards. Visualization: Presenting data through intuitive charts, dashboards, or reports.
For instance, a basic tool might sample 10% of user sessions and extrapolate trends, missing critical friction points. Robust real user monitoring solutions, like Userpilot , capture 100% of interactions, ensuring you see the full picture: every hesitation, every bottleneck, and every Aha moment.
Social listening tools : Software for monitoring online conversations, brand mentions, and trends. Product analytics tools : Platforms that allow you to track and analyze user interactions within a product to help you optimize the userexperience and improve product performance. Lookback Type : User testing tool.
We organize all of the trending information in your field so you don't have to. Join 96,000+ users and stay up to date on the latest articles your peers are reading.
You know about us, now we want to get to know you!
Let's personalize your content
Let's get even more personalized
We recognize your account from another site in our network, please click 'Send Email' below to continue with verifying your account and setting a password.


Let's personalize your content