This site uses cookies to improve your experience. To help us insure we adhere to various privacy regulations, please select your country/region of residence. If you do not select a country, we will assume you are from the United States. Select your Cookie Settings or view our Privacy Policy and Terms of Use.
Cookie Settings
Cookies and similar technologies are used on this website for proper function of the website, for tracking performance analytics and for marketing purposes. We and some of our third-party providers may use cookie data for various purposes. Please review the cookie settings below and choose your preference.
Used for the proper function of the website
Used for monitoring website traffic and interactions
Cookie Settings
Cookies and similar technologies are used on this website for proper function of the website, for tracking performance analytics and for marketing purposes. We and some of our third-party providers may use cookie data for various purposes. Please review the cookie settings below and choose your preference.
Strictly Necessary: Used for the proper function of the website
Performance/Analytics: Used for monitoring website traffic and interactions
Introduction to customer satisfaction surveys Customer satisfaction surveys are vital tools for understanding what customers think, feel, and experience. Surveys provide a range of insights, from quick feedback after a purchase to in-depth assessments of brand loyalty. Don’t worry, we’ve got you.
Pro Tip: Pair your quick wins with data. A dashboard showing metrics like feature adoption or user engagement amplifies your credibility. Advanced Tactics: Stakeholder Mapping: Use tools like the Stakeholder Alignment Blueprint (available on jonihoadley.com) to identify key goals and concerns. Click here to download.
Reveal Embedded Analytics For SaaS companies, user growth should accelerate success, not burden your analytics infrastructure. Yet for many SaaS leaders, BI costs surge faster than customer acquisition, and legacy systems struggle to cope with growing data volumes and concurrent user demands. The result? You’re not alone.
Heres how to take insights from customer feedback and turn them into results. You can download the free e-guide, here ! Build a foundation that drives action Use reportingtools to translate feedback into trends. Dont wait for quarterly NPS reports. Every retailer gets product complaints and feature requests.
Think your customers will pay more for datavisualizations in your application? But today, dashboards and visualizations have become commonplace. Turning embedded analytics into a source of revenue means integrating advanced features in unique, hard-to-steal ways. Proven approaches to achieving analytics maturity.
Most product teams get mobile app analytics wrong. They track 47 different key performance indicators (KPIs) in their mobile analytics platform , spend hours debating dashboard numbers, yet can’t predict which users will churn next week The problem here isn’t a lack of data.
When you’re building a mobile product , data is your lifeline. Whether for tracking feature adoption or spotting drop-off points, the right analyticstool can make or break your growth. Some tools are great for marketers, and others are for product or development teams.
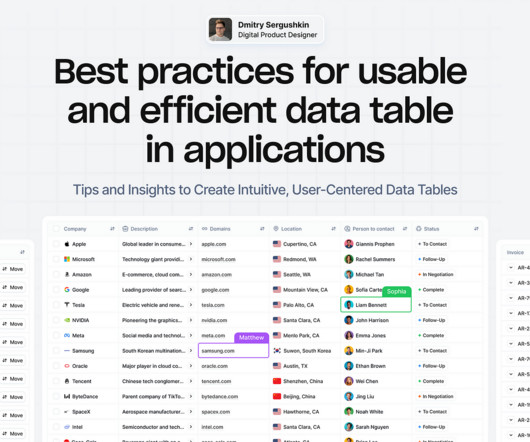
Tips and Insights to Create Intuitive, User-Centered DataTables Data tables provide a structured way to organize and manage information, making it easier to analyze and visualizedata effectively. However, creating effective data tables is not as simple as organizing rows and columns.
In our latest Productside webinar, Becoming an Effective Product Management Leader , Principal Consultants Roger Snyder and Kenny Kranseler delivered a no-nonsense roadmap for new leaders who want to nail their first 90 days (and beyond) and get the tools on how to become a product management leadereffectively. Show them the data they lack.
Think your customers will pay more for datavisualizations in your application? But today, dashboards and visualizations have become table stakes. Turning analytics into a source of revenue means integrating advanced features in unique, hard-to-steal ways. Five years ago, they may have.
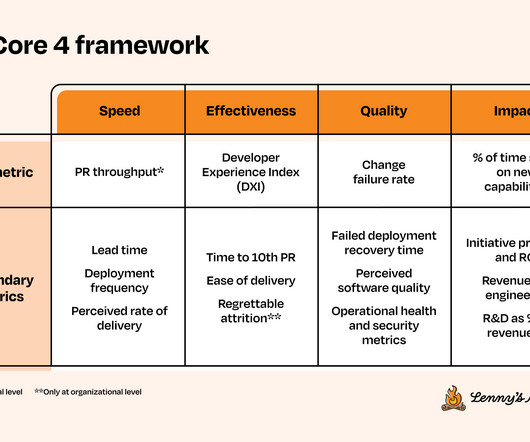
Her background is in developer tools and distributed systems. Quantitative measurements provide insight into what is happening, but qualitative insights tell us why. With Core 4, you can collect a baseline measurement via self-reported metrics. For more, check out her LinkedIn and her blog.
It’s what you do with the behavior data your app collects. And by behavior data, I dont mean installs (thats the easy part). I mean what happens after the download: how users navigate, what features they engage with, and where they drop off. What separates a good app from a great one? What is mobile app tracking?
You can download the free, comprehensive e-guide, here. Surveys, combined with open text analysis, however, hold immense potential for uncovering deeper customer insights from customer feedback. Use these questions liberally to uncover richer insights.
Listen to the audio version of this article: [link] A Product Strategy System The product strategy system in Figure 1 consists of four main parts: people, processes, principles, and tools. Are the right tools applied? Next, collect the relevant data. Are they properly empowered and adequately qualified? If so, what are they?
Every data-driven project calls for a review of your data architecture—and that includes embedded analytics. Before you add new dashboards and reports to your application, you need to evaluate your data architecture with analytics in mind.
It makes your app easier to find and increases the likelihood of it being downloaded. In fact, 72% of consumers say they only engage with personalized messaging, such as recommendations, messages, and visuals tailored to their behavior. Review your app analytics to identify underused features. Nike is the best example here.
Quantitative data alone doesn’t reveal intent, only outcomes. By combining contextual insights from session replays , heatmaps, and behavior analytics, user session analysis helps you interpret metrics through the lens of real user journeys. Tools can track every click and interaction.
Organizations that rely on a single-channel feedback approach may overlook valuable insights. These missing insights are crucial for understanding customer needs and expectations. Omnichannel feedback allows businesses to capture insights from every touchpoint, creating a 360-degree view of the customer journey.
Overview: Mobile app analytics metrics Below is a quick summary of the mobile metrics every PM should be tracking. 6 Acquisition App downloads Track initial user acquisition and measure marketing campaign effectiveness. 6 Acquisition App downloads Track initial user acquisition and measure marketing campaign effectiveness.
Dashboard design can mean the difference between users excitedly embracing your product or ignoring it altogether. Great dashboards lead to richer user experiences and significant return on investment (ROI), while poorly designed dashboards distract users, suppress adoption, and can even tarnish your project or brand.
Their support team personally follows up, logs the conversation, and shares insights with leadership. Lesson 3: Let the data challenge your assumptions Tough feedback isn’t always easy to hear—but it’s essential. Lesson 4: Share feedback across the entire organization At Company Sage, feedback doesn’t stay hidden in dashboards.
They include fixes, enhancements, and new features , related to the product's hardware, software, and services. Sunsetted features : Focused on features or services being retired, these notes inform users about timelines and provide alternatives. They are concise, reassuring users that identified problems have been resolved.
You’ve just downloaded the hottest new app everyone’s talking about. Customer onboarding is the process of welcoming new customers to your product or service and helping them utilize the product and maximize the value of their purchase. You can even automate your onboarding emails with certain other tools.
According to a 2024 analysis , on average, over 95% of users who download a new mobile Android app abandon it within the first 30 days. Put simply, app downloads are great but insufficient. How do app users interact with it from the moment they download it and beyond? Userpilot ‘s mobile app performance dashboard.
Embedding dashboards, reports and analytics in your application presents unique opportunities and poses unique challenges. We interviewed 16 experts across business intelligence, UI/UX, security and more to find out what it takes to build an application with analytics at its core.
A mobile app conversion rate (CVR) tracks the percentage of your app's users who took a desired action, such as: Downloading your app. Optimize app store presence Your app's app store listing directly impacts its visibility and eventual app downloads. What is an app conversion? Isolate the variables to test.
App download(acquisition): The app store page converts that curiosity into an install. Customer loyalty(retention): With a mobile onboarding tool such as Userpilot , you can send regular prompts, personalized content, and thoughtful push notifications, and keep satisfied users returning. Then plot those moments in a single visual map.
Userpilot gives you the tools to improve activation, drive adoption, and increase retention without writing any code. They might not even be looking for your tool yet. That means they’re connecting integrations, inviting teammates, or running their first reports. So, are they signing up for webinars or downloading whitepapers?
The answer lies in offering what others dontfeatures that make life easier and smarter, like real-time financial insights, savings alerts that actually help and seamless integration with the digital tools people already use. Smart insights are todays realvalue. Plain and simple, generic wont cut it anymore.
When your customers come to your app, what do they see: clunky, outdated dashboards or a sleek, modern interface? If your embedded analytics are looking stale, leverage these free graphics libraries to take your embedded analytics offerings above and beyond.
App engagement refers to how users interact with your mobile app, beyond just downloading it. App engagement metrics provide quantitative insights into user interactions with your app. Based on this insight, you could redesign the feature or offer more in-app guidance to increase feature interaction.
Memory Leak Detection & Resolution Are there any memory leaks present (use profiling tools)? Implement efficient data fetching. Use appropriate data formats. Background Process Management Are background tasks optimized for minimal battery and data usage? Implement HTTP and local data caching. Minimize steps.
AI-driven user testing, video insights, plus seamless app distribution and expert resourcesâ discover Centercode 10x. Platform Overview Managed Services Compare Plans What's New? Download it now What's Delta Testing? Start for free , scale as your program grows. This guide has all the answers.
With Userpilots mobile solution , you can personalize in-app flows, trigger context-aware push notifications, and capture real-time insights: all without writing a single line of code. To show you how, Ill cover seven strategies that smooth out friction, enhance user engagement, and turn one-off app downloads into returning customers.
Which sophisticated analytics capabilities can give your application a competitive edge? In its 2020 Embedded BI Market Study, Dresner Advisory Services continues to identify the importance of embedded analytics in technologies and initiatives strategic to business intelligence.
When data stays siloed by channel—store surveys over here, app reviews over there—it’s nearly impossible to connect the dots and holistically understand the full customer experience. But without a connected system for collecting and acting on those signals, valuable insights get lost. It can cost them loyalty, revenue, and relevance.
If you arent invited to the diligence party, rattle some cages: Arm Corp Dev: Provide them a short list of mission-critical data you must have before closing. Get Your PM Leader First 90 Days template pack Download Now When Integration Feels Like a Circus Day 1 is everything, Brian said. Brians advice? People issues come first.
One look at your mobile app analyticsdashboard, and you just want to shut your eyes and scream in frustration. You aim to extract meaningful insights to improve app performance and user engagement. What decision will this data influence? Data is not fulfilling its value if it is not making an impact on your product.
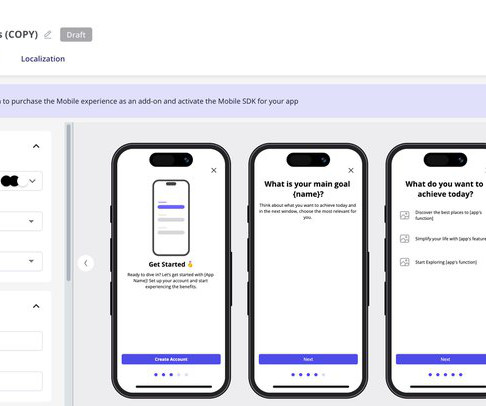
While downloads are rolling in after months of development and a well-formed launch marketing plan, your mobile app adoption metrics show a concerning pattern: users sign up, look around, and quit the app almost immediately. Userpilot makes SaaS localization remarkably simple with AI-powered translation services. Congratulations!
The possibilities for embedded analytics to drive real value for businesses, end users, and society are as fascinating as they are limitless. No matter the industry, brand after brand is finding that analytics can be the solution to a multitude of business challenges.
Youll also see how Userpilots all-in-one localization, onboarding, and analytics features make the process easier. 9 out of the 10 biggest mobile app download markets are non-English speaking, and these countries generated 88% of the Google Play app downloads in 2024. How do you go about it?
What you’ll learn: How Community Notes actually works —a deep dive into the groundbreaking algorithm that rewards “bridging agreement” instead of majority rule The seemingly crazy yet brilliant way this idea survived multiple CEO changes —from Jack to Parag to Elon How this project started with a dumpster fire GIF (literally) (..)
AI-driven user testing, video insights, plus seamless app distribution and expert resourcesâ discover Centercode 10x. Platform Overview Managed Services Compare Plans What's New? Download it now What's Delta Testing? Start for free , scale as your program grows. This guide has all the answers.
LinkedIn | Book aMeeting A landing page is a standalone web page designed to convert visitors into customers or leads, focusing on a single goal such as signing up for a newsletter, downloading a resource, or making a purchase. of marketers reported higher conversion rates in 2023 compared to 2022, as per the samesource.
Download this guide for practical advice on how to use a semantic layer to unlock data for AI & BI at scale. Download this guide for practical advice on how to use a semantic layer to unlock data for AI & BI at scale. How to enable data teams to model and deliver a semantic layer on data in the cloud.
We organize all of the trending information in your field so you don't have to. Join 96,000+ users and stay up to date on the latest articles your peers are reading.
You know about us, now we want to get to know you!
Let's personalize your content
Let's get even more personalized
We recognize your account from another site in our network, please click 'Send Email' below to continue with verifying your account and setting a password.


Let's personalize your content