Remove Data Visualization Remove Looker Remove UX
article thumbnail

Dashboard That Works: A Step-by-Step Guide for Startups in 2025

UX Planet

How to plan a dashboard people will use: 10 Key Steps Dashboard user interface elements in light and dark modes Our team has built dashboards for a wide range of businesses, and we’ve picked up a few key insights along the way. A truly functional dashboard is always the result of collaboration.

article thumbnail

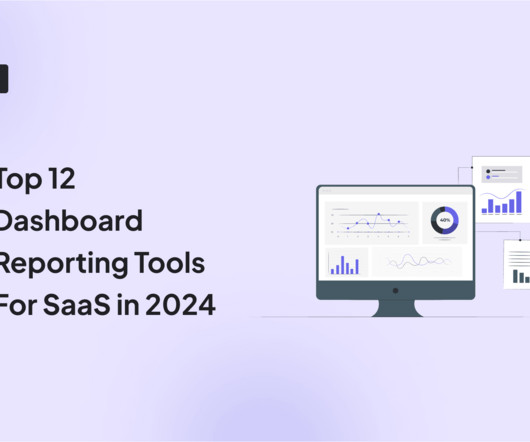
Top 12 Dashboard Reporting Tools For SaaS in 2024

Userpilot

As you’re researching dashboard reporting tools, you’ve probably noticed how hard it is to find reliable information on the available solutions. TL;DR Dashboards display critical business data in real-time, streamlining decision-making and focusing on key metrics. Let’s dive in!

Insiders

Sign Up for our Newsletter

This site is protected by reCAPTCHA and the Google Privacy Policy and Terms of Service apply.

article thumbnail

Guide to Self-Serve Analytics For SaaS

Userpilot

If you are a SaaS company, the chances are you’ve come across the term “self-serve analytics” at some point online. Unlike traditional data analysis methods, self-serve analytics equips everyone in your organization to explore data and take the right actions in real time. Choosing a good business intelligence tool.

article thumbnail

The Ultimate Guide to Google Analytics 4 for UX Designers and Business Owners

UX Planet

Master Google Analytics 4 for user behavior analysis, UX design optimization, and enhanced website performance to improve sales. Hi there, I was looking into Google Analytics 4 and found an article by Alice Emma Walker. If you know about Universal Analytics , it’s going away on July 1, 2024. It’s six years old.

article thumbnail

Business Intelligence Analyst Career Path

Userpilot

TL;DR A business intelligence (BI) analyst is a data specialist who helps businesses translate raw data into actionable insights. According to Glassdoor data, the estimated total pay for a Business Intelligence Analyst in the United States is $134,912 per year, with a base salary of $99,503 and additional pay of $35,409.

article thumbnail

Cross-Platform Analytics Guide for SaaS Companies

Userpilot

Tracking cross-platform analytics is essential for product teams to see a complete view of customer behavior. TL;DR Cross-platform analytics is the activity of tracking and analyzing user behavior across multiple platforms or devices. Tools like Google Analytics or Amplitude allow you to track user behavior across all platforms.

article thumbnail

Reveal VS Looker for Embedded Analytics; Which Solution Is Better for You?

Reveal

Reveal Embedded Analytics. Collecting data is easy, yet interpreting that same data is difficult. This is where tools such as Reveal and Looker come in handy – they convert raw data into easy-to-understand and easy-to-use insights that enable organizations to reshape and modernize the way they do business.