This site uses cookies to improve your experience. To help us insure we adhere to various privacy regulations, please select your country/region of residence. If you do not select a country, we will assume you are from the United States. Select your Cookie Settings or view our Privacy Policy and Terms of Use.
Cookie Settings
Cookies and similar technologies are used on this website for proper function of the website, for tracking performance analytics and for marketing purposes. We and some of our third-party providers may use cookie data for various purposes. Please review the cookie settings below and choose your preference.
Used for the proper function of the website
Used for monitoring website traffic and interactions
Cookie Settings
Cookies and similar technologies are used on this website for proper function of the website, for tracking performance analytics and for marketing purposes. We and some of our third-party providers may use cookie data for various purposes. Please review the cookie settings below and choose your preference.
Strictly Necessary: Used for the proper function of the website
Performance/Analytics: Used for monitoring website traffic and interactions
Think of Net Promoter Score (NPS) software as a tool to measure your customers’ feelings about your product, and categorize them based on their level of loyalty (promoters, neutrals, and detractors). The great advantage of these tools is that they streamline the creation, distribution, and analysis of NPS surveys.
This unique combination developed both her analytical thinking skills and her ability to question assumptions – capabilities that would later prove valuable in her product career. Over ten years, she rose through the ranks until everyone in the company reported to her.
Without effective UX analytics that goes beyond collecting data, you’re losing valuable customers. Unfortunately, the research backs this up, with a staggering 90% of users reporting that they stopped using an app due to poor performance. It covers key topics, such as: Defining UX analytics. What is UX analytics?
While “use data to drive decision-making” sounds obvious, there’s a HUGE gap between saying it and doing it well. So, how do you get started with product analytics ? In this article, we’ll talk about: What product analytics is and why you need a solid strategy. What is product analytics?
Organizations look to embedded analytics to provide greater self-service for users, introduce AI capabilities, offer better insight into data, and provide customizable dashboards that present data in a visually pleasing, easy-to-access format.
Let’s review everything your customer success team has to do in the absence of any customer success tools. Collect customer data to calculate complex formulas for tracking metrics, monitor customer health scores, and resolve support tickets while continuously trying to improve retention and expansion.
You can gather all the user feedback or behavioral data you want or even generate tons of Google Analyticsreports. Despite all these efforts, you’re probably still not acting on product analytics correctly. Why actionable product analytics are important. This causes siloed data and integration issues.
You see, although we work hard to make Userpilot the best product adoption tool on the market, we know it isnt the perfect fit for every business. A quick look into Userpilot In a nutshell, Userpilot is an all-in-one product growth platform that enables businesses to increase product metrics at every stage of the user journey.
When your company adopts multiple SaaS solutions to drive productivity, you unknowingly create a perfect storm for data fragmentation. Your customer information lives in Salesforce, while your support tickets are in Zendesk, your product usage data in Mixpanel, and your marketing campaigns in HubSpot. Sound familiar?
In the fast-moving manufacturing sector, delivering mission-critical datainsights to empower your end users or customers can be a challenge. Traditional BI tools can be cumbersome and difficult to integrate - but it doesn't have to be this way.
The collaboration between AMS and MIT researchers has yielded impressive results, with AI tools not only matching human analysts in identifying customer needs but often exceeding themespecially for emotional needs that humans might overlook. But it is changing, with AI tools that are transforming how we uncover and analyze customer needs.
If youre looking for AI tools that will help you make your work more efficient, you come to the right place. This collection of AI tools will be very helpful for all product designers. Its also good at analyzing complex documents (like multi-page PDF reports) and extracting specific data fromthem.
Reveal Embedded Analytics For product owners, leveraging data is not just an advantageits a necessity. Product analytics empowers you to understand gaps in your offering and how users engage with your product. Both embedded analytics and product analytics are designed to help product owners in diverse ways.
We covered how to manage messy opportunity solution trees , the most common challenges teams face when getting started with the discovery habits, what Im working on next, and so much more. I started my career as a software engineer. How are we building production-quality software? I think that was in 2004. What does that mean?
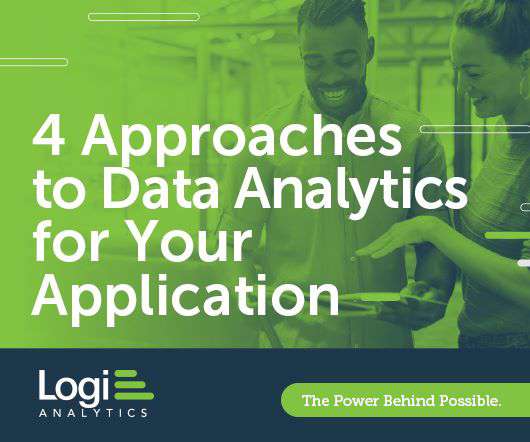
The world of dataanalytics is changing fast as organizations look to gain competitive advantages through the application of timely data. How do you differentiate one solution from the next? How do you differentiate one solution from the next? 4 common approaches to analytics for your application.
You know your product collects tons of data. Datavisualizationtools help turn your messy spreadsheets into clear, interactive insights. The best ones dont even need SQL or data science skills. Because product analytics should be easy and accessible for everyone, not just data experts.
90% of executives say they prefer visual storytelling over dense reports. Its a technique borrowed from the world of film and designbut it might just be the most underrated tool in a product managers toolbox. Customers dont care about data structures. After : Whats better now that the solution exists?
Since then, I’ve had the privilege of helping organizations build cutting-edge AI solutions, from early neural nets to the first wave of LLMs. Yet, no matter how sophisticated the technology got, one problem remained stubbornly consistent: Decision-making was still too slow. The insights were buried in dashboards.
In the retail industry, customer feedback is your early warning system, your innovation engine, and your most honest performance review. But this system only works if you take action on the feedback collected. Heres how to take insights from customer feedback and turn them into results. Dont wait for quarterly NPS reports.
In the rapidly evolving healthcare industry, delivering datainsights to end users or customers can be a significant challenge for product managers, product owners, and application team developers. But with Logi Symphony, these challenges become opportunities. But with Logi Symphony, these challenges become opportunities.
Featuring live examples, a hands-on walkthrough of real automations, and a breakdown of tangible business impact, the session provides a clear view of how companies are integrating feedback into their external systems to inform decisions and strengthen customer relationships. Without logging into another tool. What about Excel?
Which product feedback software should you choose for your SaaS? The choice is tough because there’s no single tool that covers all use cases. What’s worse, you will find multiple tools in each category, making it incredibly difficult to pick the tool that satisfies your needs and offers the best value for money.
To better understand the common challenges organizations face with digital feedback tools, we conducted a comprehensive market research study that revealed several critical pain points. When one tool gathers feedback via email and another through your website, consolidating all that data and customer feedback can be nearly impossible.
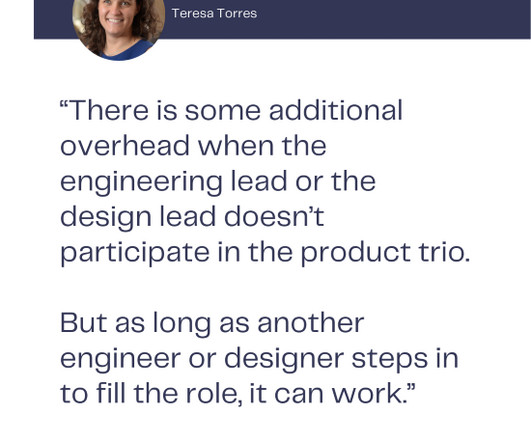
In fact, the product team at Ramsey Solutions shared how using the term “engineering lead” caused confusion and even discouraged engineers from participating in the trio. Our more senior engineer might be most interested in system architecture, code reviews, and mentoring other engineers. They lead product discovery.
In the rapidly-evolving world of embedded analytics and business intelligence, one important question has emerged at the forefront: How can you leverage artificial intelligence (AI) to enhance your application’s analytics capabilities? Infusing advanced AI features into reports and analytics can set you apart from the competition.
When you’re building a mobile product , data is your lifeline. Whether for tracking feature adoption or spotting drop-off points, the right analyticstool can make or break your growth. But if you ask me, theres simply no one-size-fits-all solution. What works for a startup might not scale for an enterprise.
Most product teams get mobile app analytics wrong. They track 47 different key performance indicators (KPIs) in their mobile analyticsplatform , spend hours debating dashboard numbers, yet can’t predict which users will churn next week The problem here isn’t a lack of data.
Are you struggling to make sense of scattered user data? The right customer analyticsplatform helps you uncover exactly how customers interact with your product: so you can spot issues early, optimize user journeys, and drive sustainable growth. Choose the best fit for your needs and transform data into actionable strategies.
Reveal Embedded Analytics Today’s business users expect more than static dashboards or delayed reports. They want to explore live data, uncover insights, and take action in real time. However, delivering that experience inside a software product or platform is not easy.
Embedding dashboards, reports and analytics in your application presents unique opportunities and poses unique challenges. We interviewed 16 experts across business intelligence, UI/UX, security and more to find out what it takes to build an application with analytics at its core.
Case Study: Improving Data-Driven Decision Making for CSR Leadership Civian is a data-driven platform designed to help businesses measure, optimize, and showcase the social and economic impact of their investments in communities. We proposed 4 high-impact solutions through prototypes on Figma.
If your software is slow or buggy, users wont stick around for long. Thats where real user monitoring tools come inthey provide real-time insights into how users engage with the app , helping you detect performance issues before they impact your bottom line. Autocapture events dashboard in Userpilot. The worst part?
In this episode of Productside Stories, Neha Bansal , Head of Product at Meta Ads Manager Reporting, joins Nicole Tieche to discuss her career, the high-speed role of AI in advertising, and how PMs can stay ahead of industry shifts. Stepping into product leadership means balancing strategic vision, customer focus, and emerging tech.
How Companies Are Funding User Research in 2025: Insights from the User Interviews Research Budget Report User Interviews 2025 Research Budget Report is a crucial resource for understanding how modern organizations are approaching the financial side of user research. Only 17% experienced reductions. Lets unpack each.
Which sophisticated analytics capabilities can give your application a competitive edge? In its 2020 Embedded BI Market Study, Dresner Advisory Services continues to identify the importance of embedded analytics in technologies and initiatives strategic to business intelligence.
Reveal Embedded AnalyticsData-driven companies have a hidden advantage! Theyve consistently outperformed their counterparts, reporting significantly higher metrics across operational efficiency (81% vs. 58%) , revenue growth (77% vs. 61%), and employee satisfaction (68% vs. 39%). How is this possible?
Reveal Embedded Analytics We know how difficult it is to create dashboards, especially for web applications. However, running business operations or targeted campaigns without insights into their effectiveness is not an option. Thats what dashboards are for. They track everything from user behavior to system performance.
Delivering great AI customer service depends on more than just sophisticated AI models – it relies on real-time data and access to business systems like CRMs, billing platforms, and past conversations. With MCP, businesses can integrate AI faster, scale it across more systems, and deliver better support with less effort.
A customer expansion strategy is a playbook for increasing the revenue from your existing customers, for example, by selling them additional products and services or encouraging them to upgrade to higher plans. As your team grows and you hire new people or other departments adopt the tool, the number of seats needed increases.
The complexity of financial data, the need for real-time insight, and the demand for user-friendly visualizations can seem daunting when it comes to analytics - but there is an easier way. Together, we can overcome these hurdles and empower your users with the data they need to drive success.
For example, let’s say your team is developing new project management software for small- to medium-sized businesses. For example, the travel and events management software, Groupize, created an interactive assistant – G.G. Frequency of reported issue. Determine user roles to tailor their experiences. The result?
Well implemented, product demos help to: Improve user engagement : Today’s B2B buyers are independent—they want to research and evaluate solutions on their own terms. In fact, the 2024 Buyer Experience Report by 6sense found that a whopping 85% of buyers establish purchase requirements before even contacting sales.
In 2006, British mathematician Clive Humby made the infamous statement: Data is the new oil. Like oil, raw data needs to be refined, processed and turned into something useful because its value lies in its potential. Unfortunately, most people have yet to understand what it truly means to use data. moment that makes users stick.
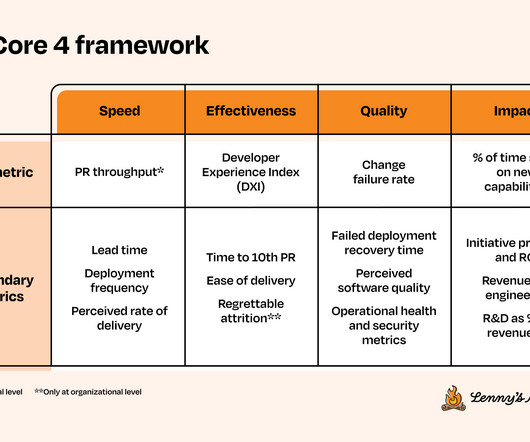
Her background is in developer tools and distributed systems. I’ve yet to come across a software leader who isn’t. These metrics focus on software delivery capabilities (deployment frequency, lead time to change, change failure rate, and time to recover from a failed deployment), but they can often be misapplied.
This white paper shares why, in a world full of new features, traditional reporting is still a critical requirement for businesses. Read further to understand the reasons behind its lasting relevance and why it should continue to be an integral part of modern analyticssolutions.
We organize all of the trending information in your field so you don't have to. Join 96,000+ users and stay up to date on the latest articles your peers are reading.
You know about us, now we want to get to know you!
Let's personalize your content
Let's get even more personalized
We recognize your account from another site in our network, please click 'Send Email' below to continue with verifying your account and setting a password.


Let's personalize your content