

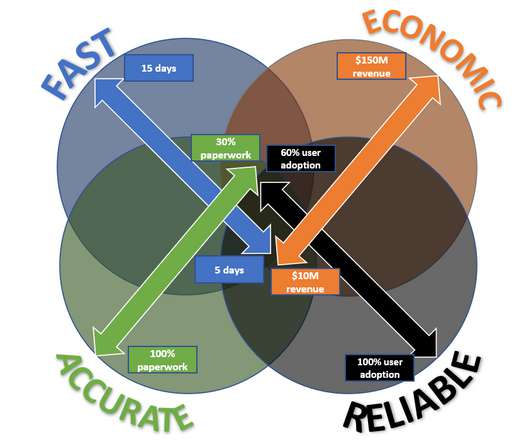
Applying a ‘Time-To-Market’ KPI in product
Mind the Product
JULY 8, 2021
When it comes to implementing this for your product, there isn’t much information on how to do this. This article will drive you through the journey on how to apply TTM KPI in your organization. Read more » The post Applying a ‘Time-To-Market’ KPI in product appeared first on Mind the Product. What is Time-To-Market?


Let's personalize your content