This site uses cookies to improve your experience. To help us insure we adhere to various privacy regulations, please select your country/region of residence. If you do not select a country, we will assume you are from the United States. Select your Cookie Settings or view our Privacy Policy and Terms of Use.
Cookie Settings
Cookies and similar technologies are used on this website for proper function of the website, for tracking performance analytics and for marketing purposes. We and some of our third-party providers may use cookie data for various purposes. Please review the cookie settings below and choose your preference.
Used for the proper function of the website
Used for monitoring website traffic and interactions
Cookie Settings
Cookies and similar technologies are used on this website for proper function of the website, for tracking performance analytics and for marketing purposes. We and some of our third-party providers may use cookie data for various purposes. Please review the cookie settings below and choose your preference.
Strictly Necessary: Used for the proper function of the website
Performance/Analytics: Used for monitoring website traffic and interactions
Ugly is fine — the point is to test structure and ideas. Sketch a rough layout Anything goes — from a napkin sketch to a Figma wireframe. Think through: What blocks belong “up top”? Where is the visual focus? What should jump out first? Illustration from Lukatsky’s blog Step 7. Get user feedback Show the prototype to real users.
Features and functionality Salesforce integrates with apps like MuleSoft, Slack, and Tableau to provide a comprehensive 360-degree view of the customer experience. Testing and experimentation: Braze allows you to test your content, design, and timing to see which resonates better with customers.
As a lifecycle specialist in B2B growth, youll drive the strategies that accelerate time to value and expansion, rigorously test them, and scale what works. Experimentation expertise: comfortable designing, running, and interpreting A/B and multivariate tests. How can Victor benefit your company?
Think your customers will pay more for data visualizations in your application? Five years ago they may have. But today, dashboards and visualizations have become table stakes. Discover which features will differentiate your application and maximize the ROI of your embedded analytics. Brought to you by Logi Analytics.
Data Visualization: Tools like Tableau, Power BI, or Looker are critical for communicating insights visually. Statistics & Experimentation: Understanding probability , regression , A/B testing, and causal inference is significant for product and growth roles.
However, data-heavy organizations might want a more robust, scalable solution like Tableau or Microsoft PowerBI. When it comes to studying user-experience and their interactions with your product, UserTesting comes highly recommended due to its robust set of usability-testing functions. User Research Tools for Product Managers.
Coding Focus: Both disciplines will test your ability to write clean, efficient code under time constraints. These problems often progress from easy to medium difficulty, testing your ability to work with data quickly and accurately. The emphasis is on writing clear, functional code.
Technical Round: Can include asynchronous SQL tests or live coding challenges. SQL is tested in nearly every round and is essential for daily work. Candidates must know how to build and explain dashboards using tools like Tableau, Power BI, or Looker. Explain how you would visualize an A/B test result.
Perform statistical analysis, A/B testing , and predictive modeling. Data Visualization & Reporting Create interactive dashboards and reports using Tableau, Power BI, Looker, or Excel. Hands-on experience with data visualization tools (Tableau, Power BI, Looker). Experience with Python or R for data analysis and automation.
When it comes to improving product success, your product test data works exactly the same way. From the way your customers are interacting with your product to how it’s performing in real-world environments, customer testing generates a lot of data. Being Insight-Driven During Customer Testing. First, you need structure.
TableauTableau is the biggest data visualization tool out there, with almost 60,000 customers worldwide. One of the most loved features of Tableau are their interactive reports. Tableau is the perfect choice for a data-driven team with some proficiency in data analysis. Platforms for Data Visualization 1.
They include product analytics tools, predictive analytics tools , session replay tools, heatmap tools, feedback and voice of the customer (VoC) tools, and A/B testing tools. Tableau is best for behavioral data visualization. Tableau is best for behavioral data visualization. A/B testing tools. A/B testing.
You need thorough test coverage before release — that is, you need to see how your product’s features and functions perform with real customers in their actual environments. So how do you, a resource-strapped beta team, reduce the costs of customer testing without sacrificing thoroughness or compromising the quality of your product?
Tableau is a business intelligence platform that offers data visualization and AI capabilities. Starts at Tableau Viewer’s $15/month billed annually.) A/B testing. The A/B testing tool lets you create a test that uses different elements for your web pages and monitors which elements customers engage with more.
TableauTableau is an end-to-end data analytics platform that enables the preparation, analysis, collaboration, and dissemination of big data insights. Tableau excels at self-service visual analysis, enabling users to ask novel questions of governed big data and easily share these insights throughout the organization.
Here’s a tried and tested formula: Pick a topic/keyword. Tableau – business intelligence. Tableau is recognized as the cream of the crop for its visual-based data analysis. Better yet, WordPress makes building a website accessible to anyone – even people who aren’t developers. Alternatives: Ghost, Medium, Joomla.
Tableau, Microsoft Power BI, Amplitude, FullStory, and Google Analytics are some of the most widely used no-code analytics tools. Tableau for advanced data analysis Geographic visualization on Tableau. When it comes to advanced data analytics and visualization platforms, Tableau is one of the market leaders.
re-usable) and backed by tests. Tests should be run whenever the tables update. Better still, tests can be incorporated into critical upstream processes to detect breakages in downstream dependencies. Any instabilities in metrics will thwart generating insights. Ideally, the maintenance of the metrics dictionary is via Agile.
The results of the 2018 Customer Validation Industry Survey backed up what we already knew: time is a precious commodity that test managers don’t have a lot of. Responses from over 300 companies showed how and where today’s testing professionals are spending their time. Why Test Managers Use It. Why Test Managers Use It.
A/B testing – Test product and marketing changes with real customers. Heap offers many self-service integrations from CRM and payments to testing and pipelines. An excellent complement to BI tools, Indicative is great for ad hoc analysis and quick results that can take hours in Looker and Tableau.
Tableau is the best user data visualization tool. Tableau – best user data visualization tool Tableau is a business intelligence and analytics software focusing heavily on data visualization. Tableau’s dashboards featuring KPI overview. Main Features Here's a summary of Tableau's data visualization tool.
Normally you may have different tools for messaging, attribution, a/b testing, etc that generate critical data points and you have to make sure all this data is either in the same repository and/or connected. Here are some reasons why: The true value is in knowing what to measure, how often and why.
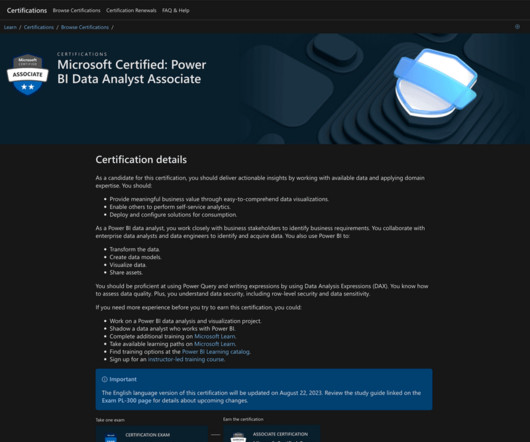
The recommended certifications for developing professional skills and improving hiring chances are Google Analytics Individual Qualification, Tableau Desktop Specialist, and Microsoft Certified: Data Analyst Associate. Tableau Desktop Specialist: Tableau offers this exam to certify your foundational understanding of Tableau Desktop.
How about this one: imagine running a community of 1,000 active testers when your only beta testing tools are Excel and Outlook. The beta testing tools you use can have a big impact on your efforts – and results. If there’s one thing customer testing professionals need more of, it’s time. Automation.
UX/UI Design and Research Teams Can Use Userpilot to: Recruit Users for Usability Tests with Usage Analytics and Segmentation Collect User Feedback with In-App Surveys Understand Product Usage with Product Analytics Get a Demo 14 Day Trial No Credit Card Required What is a business intelligence analyst? Book a demo to see it in action!
Test and iterate : Collect feedback to determine if your visualization was effective. Tableau – Best for dynamic storytelling Tableau excels at crafting clear narratives through data. Tableau dashboard. Optimize for the delivery platform : Create visual representations of data that can be viewed on any browser.
Tools like Tableau or Mixpanel allow teams to track user engagement and business metrics in a lot of detail. We test it using the Sean Ellis test which asks users how much they would miss the product if they couldn’t use it anymore. Tableau: Growth and revenue product dashboards tool. Conclusion.
Create programs to test new features, document issues, and track their resolution leading up to launch. Intermediate-to-advanced knowledge of SQL; experience with data visualization tools (Looker, Power BI, Tableau); knowledge of applied statistics. Dogfooding. Bug bashes. Quality alerts. Data analysis. Program management. Strategy.
However, data-heavy organizations might want a more robust, scalable solution like Tableau or Microsoft PowerBI. Usability testing tools such as UserTesting can help when studying user-experience and customer interactions with your product. User Research Tools for Product Managers.
But if you’re on your own, Microsoft Excel skills—or Tableau or SAS—are a must to generate the stats and charts. A/B Testing. A/B tests allow product teams to test out their hypotheses in the real world. A/B tests allow product teams to test out their hypotheses in the real world. Information Architecture.
In a response to an early draft of this series, Eric Peterson (co-founder of Automaton, previously at Tableau), made this astute observation: I wonder if instrumentation apprehension/paralysis is rooted in a fundamental lack of data literacy. Using Amplitude’s Chrome Extension (as well as the product) we test to make sure things are working.
Recently, I attended the 2018 Customer Validation Conference in southern California, where product testing experts from B2B and B2C companies (including Autodesk, Tableau, Test Fairy, FitBit, and GoPro) shared tips and lessons learned from the forefront of product development and testing.
You can A/B test your onboarding flows to see which one reduces friction and result in a higher conversion rate. Descriptive analytics tools Business intelligence tools like Power BI, Tableau, and Google Analytics can simplify many steps of the descriptive analytics process. Tracking custom events in Userpilot.
Conduct user research : Gather insights into user needs, behaviors, and pain points through interviews, surveys, and usability testing to inform design decisions. Design wireframes and prototypes : Develop wireframes and interactive prototypes to test and iterate on design concepts before implementation.
We want to listen to what the market is saying back to us” Once we understand the problem clearly enough, we start exploring the solutions space, we test directly with customers, show them solution prototypes, et cetera. This doesn’t replace the place of third-party tooling like Tableau and GoodData.
Some essential tools include Userpilot for user onboarding , Zendesk for customer support, Google Analytics for website analytics, and Tableau for data visualization. Conduct usability testing : Test new features and updates to ensure they meet customer needs and expectations. Visit Tableau blog for more details.
Essential tools for customer experience analysts include Userpilot for user onboarding, Zendesk for customer support, and Tableau for data visualization. Conduct usability testing : Test new features and updates to ensure they meet customer needs and expectations. Tableau Blog : Data visualization techniques and best practices.
Tableau – the best digital data visualization tool. Crazy Egg – the best digital analytics tool for A/B testing. Optimizely – the best digital analytics tool for multivariate testing. Integrated A/B testing. Conduct a test and measure performance from your set metrics. A dashboard from Tableau.
Tableau – the best digital data visualization tool. Crazy Egg – the best digital analytics tool for A/B testing. Optimizely – the best digital analytics tool for multivariate testing. Integrated A/B testing. Conduct a test and measure performance from your set metrics. A dashboard from Tableau.
Tableau – the best digital data visualization tool. Crazy Egg – the best digital analytics tool for A/B testing. Optimizely – the best digital analytics tool for multivariate testing. Integrated A/B testing. Conduct a test and measure performance from your set metrics. A dashboard from Tableau.
Tableau – the best digital data visualization tool. Crazy Egg – the best digital analytics tool for A/B testing. Optimizely – the best digital analytics tool for multivariate testing. Integrated A/B testing. Conduct a test and measure performance from your set metrics. A dashboard from Tableau.
Tableau – the best digital data visualization tool. Crazy Egg – the best digital analytics tool for A/B testing. Optimizely – the best digital analytics tool for multivariate testing. Integrated A/B testing. Conduct a test and measure performance from your set metrics. A dashboard from Tableau.
This allowed us to iterate on the data in a test project until we got things how we wanted them. Census is great for this because you can quickly create transformation models with just SQL and then set up a sync to push the transformed data into Mixpanel. There are two reasons.
We organize all of the trending information in your field so you don't have to. Join 96,000+ users and stay up to date on the latest articles your peers are reading.
You know about us, now we want to get to know you!
Let's personalize your content
Let's get even more personalized
We recognize your account from another site in our network, please click 'Send Email' below to continue with verifying your account and setting a password.


Let's personalize your content