This site uses cookies to improve your experience. To help us insure we adhere to various privacy regulations, please select your country/region of residence. If you do not select a country, we will assume you are from the United States. Select your Cookie Settings or view our Privacy Policy and Terms of Use.
Cookie Settings
Cookies and similar technologies are used on this website for proper function of the website, for tracking performance analytics and for marketing purposes. We and some of our third-party providers may use cookie data for various purposes. Please review the cookie settings below and choose your preference.
Used for the proper function of the website
Used for monitoring website traffic and interactions
Cookie Settings
Cookies and similar technologies are used on this website for proper function of the website, for tracking performance analytics and for marketing purposes. We and some of our third-party providers may use cookie data for various purposes. Please review the cookie settings below and choose your preference.
Strictly Necessary: Used for the proper function of the website
Performance/Analytics: Used for monitoring website traffic and interactions
Data from 99firms found that 77% of companies run A/B tests. Many companies choose Mixpanel A/B testing to run their product experiments. To help you make a decision, in this blog, we will go over the specifics of A/B tests in Mixpanel, uncover its pros and cons, and introduce you to a better alternative.
Analytics dashboards are visualization tools that give you an overview of key metrics. In this article, we’ll discuss 10 analytics dashboard examples. It will give you a better understanding of the type of metrics to monitor in your dashboard and help you draw product growth insights from them. Book a demo to learn more.
The short answer is: with product dashboards! In the article, we’re looking at how to build effective product manager dashboards and the key metrics we may want to populate them with at different stages of the product lifecycle. We also explore tools for building product dashboards and data analysis. Let’s get to it.
A customer engagement dashboard is invaluable for interpreting customer data and making the right business decisions. Read on to learn how to choose the right engagement metrics for your dashboard and how to build one code-free. User engagement dashboard tools to consider: Userpilot, Amplitude, and Mixpanel.
Wondering how an NPS dashboard can help you track customer loyalty? This is where the NPS dashboard comes in. Let’s see how the dashboard can help you extract insights from NPS responses and improve customer loyalty. What is the NPS dashboard? Why do you need an NPS dashboard?
These steps are designed for even the humblest of budgets and will help not just with acquisition, but with the entire spectrum: validation, testing, engagement, retention, referrals, and revenue. Now it’s time to put your app and positioning to the test. REGISTER YOUR DOMAIN AND CREATE A LANDING PAGE. Register your domain (e.g.,
A/B tests play a crucial role in driving product adoption, which makes it important to choose the right A/B testing software to run them. In this blog, we’ll handpick a few A/B testing tools worth your attention. In this blog, we’ll handpick a few A/B testing tools worth your attention. Let’s dive right in.
Usability testing: Observe users as they interact with your product to identify usability issues and collect feedback on user experience. E.g., Identify navigation issues in your analytics dashboard based on real-time user interactions. E.g., Test different tooltip designs to find which gets more engagement.
Surely all software companies are familiar with beta testing, but how well do you actually do it? We talked to Colin Ulin, senior software engineer at Pocket Prep, about their low-effort high-outcome beta testing strategy and design-thinking development process. A feedback-driven example of beta testing.
Beta release notes : These notes preview upcoming features still in testing, inviting feedback from early adopters. For example, telling users that the dashboard loading time has been reduced by 50% shows commitment to continuous improvement to keep them happy. Chameleon announces release changes with a blog post.
What is concept testing and how can it help accelerate your product-led growth ? In this article, we’ll go over some concept testing examples from some of the best B2B and B2C brands to help you get started with your strategy. Airbnb failed to concept test its logo and faced ridicule due to its design.
We were so inspired by Tali’s enthusiasm that we just had to share her story here on the Product Talk blog. To prepare for the workshop, Tali created a fictional case study, and with the help of ChatGPT, she generated six interview snapshots and some analytics dashboards. Do you have your own Product in Practice you’d like to share?
Analytics Which platform gives teams the clearest insights without drowning them in dashboards? Its the self-serve analytics platform that transforms raw numbers into intuitive dashboards. The platforms real-time performance dashboards highlight not just whats happening, but why its happeningso you can course-correct on the fly.
It can become a sickness when there are too many metrics flying around and some are going up, others going down, and actions are paralyzed because there’s too much discussion about whether some test has illustrated an improvement or not. Kerry Rodden, a User Experience Researcher at Google says in a blog post on Google Ventures’ blog.
Leveraging product analytics isnt just about making pretty dashboards; its about viewing your existing data as a learning opportunity to make informed decisions with your onboarding strategy. At Userpilot, we create quarterly dashboards organized by release. These dashboards dont just collect numbers; they tell a story.
Analytics Which platform gives teams the clearest insights without drowning them in dashboards? Its the self-serve analytics platform that transforms raw numbers into intuitive dashboards. The platforms real-time performance dashboards highlight not just whats happening, but why its happeningso you can course-correct on the fly.
Intercom’s blog is the growth engine that powers much of Intercom’s marketing and it in turn is powered by WordPress. WordPress lets users build everything from blogs to full-blown websites with 100s of themes to choose from. Here’s a tried and tested formula: Pick a topic/keyword. WordPress – CMS. Promote it.
The term “beta testing” is often associated with programmers who are testing out a new version of their software. That said, beta testing in marketing is just as important. Having clear goals , the right testers, an appropriate timeframe, and proper documentation will guarantee that your beta test is a success.
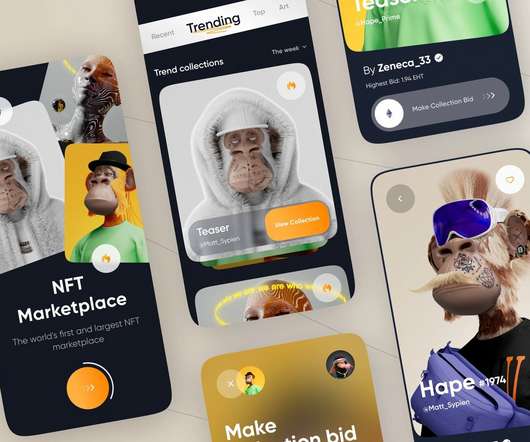
This blog will be sharing some of the most informative and interesting development of web3’s favorite NFT marketplace. NFT dashboard/Storefront The NFT dashboard is a display for all the digital assets in the marketplace, open for the users to trade them. The blog discussed is just the tip of the iceberg.
This methodology helps startups quickly test and refine their ideas, avoiding time wasted on elaborate plans that may not succeed. Top blog posts of Eric Ries to read Eric Ries shares his insights on his blog, Startup Lessons Learned. Product usage dashboard in Userpilot. A/B testing in Userpilot.
User testing tools : Platforms that allow you to observe real users interacting with your products to gather usability insights and identify design issues. UserTesting Type : User testing tool. Best for : Real-time user feedback and usability tests. UserTesting allows teams to gather real-time user feedback from usability tests.
In this blog, we’ll explore her background and the journey that shaped her insights. She is now a product discovery coach where she supports digital product teams in implementing ongoing discovery practices that include conducting interviews, developing prototypes, and thoroughly testing assumptions. A/B testing in Userpilot.
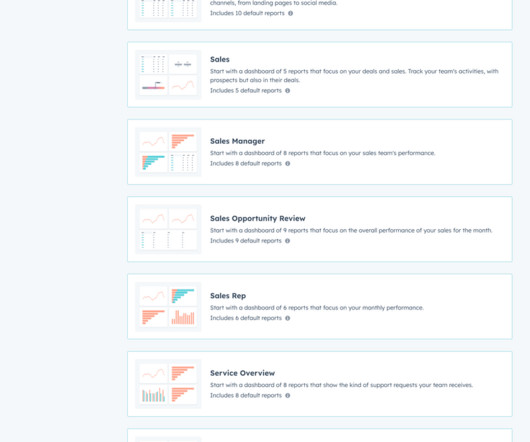
It has multiple analytics functionalities, including event tracking, A/B testing, customer segmentation, goal tracking, and reporting dashboards. HubSpot offers a 30-day free trial so you can test out its marketing software before committing to a paid plan. Source: HubSpot. Source: HubSpot. Source: HubSpot.
UX/UI Design and Research Teams Can Use Userpilot to: Recruit Users for Usability Tests with Usage Analytics and Segmentation Collect User Feedback with In-App Surveys Understand Product Usage with Product Analytics Get a Demo 14 Day Trial No Credit Card Required What is a business intelligence analyst? Book a demo to see it in action!
Their tightly packed visual dashboards organize the data in a way that makes it easy to map out sales funnels, track common paths, uncover behavior patterns, and identify friction points. In terms of reporting, UXCam’s drag and drop team dashboard is easy for non-technical team members to use. Product Analytics. Session Insights.
Here are the key features to look for in an analytics tool: segmentation, tracking capabilities, A/B testing , and data visualization with analytics dashboards. Mixpanel is a marketing analytics tool that imports data and transforms it into visual and interactive dashboards. Userpilot enables you to track feature usage.
If Rohini’s team is making changes to the UI or the front end, they can test quickly and easily, but because their core product is payments-based, much more rigor is required compared to your typical software product. If we’re doing an A/B test, our analyst is heavily involved in looking at that data. Rohini: Definitely.
One of the most impactful steps that your company can take is to create a shared dashboard that connects employees across your organization to a single source of truth. Indicative dashboards allow you to host a collection of KPIs and metrics that update in near real-time so you can keep track of regular business performance.
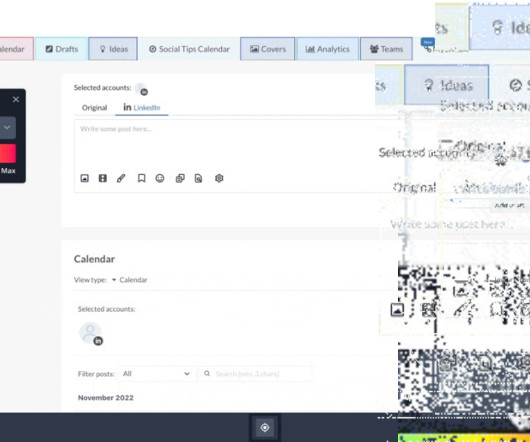
I did a bit of research on the cost-benefit of having a centralised dashboard to manage client’s ads with the selected channels and running multiple channels for individual clients. While the designer was busy sketching out the interface and other web pages, the dev was equally busy coding the dashboard and figuring out the integrations.
And all created screenshots and screen recordings are directly stored in your project dashboard, making bug tracking and feedback a lot of fun! f19N Obtrusive Live Test. This Chrome extension for developers is a sandboxed, extendable Webpage Testing Framework. It is very simple to create the tests yourself. Link: Hiver.
Track key product metrics with analytics dashboards. Through iterative testing and continuous improvement , they ensure the product architecture and design remain robust, technical debt-free, and benefit from the latest technological advancements. Analytics dashboards : This feature lets you track key product metrics with ease.
Data visualization, for example in a dashboard, aids in its interpretation and trend tracking. Next, use the insights to form hypotheses and test solutions iteratively. Usability testing sessions. It’s good practice to visualize all the data collected for a particular purpose in one dashboard.
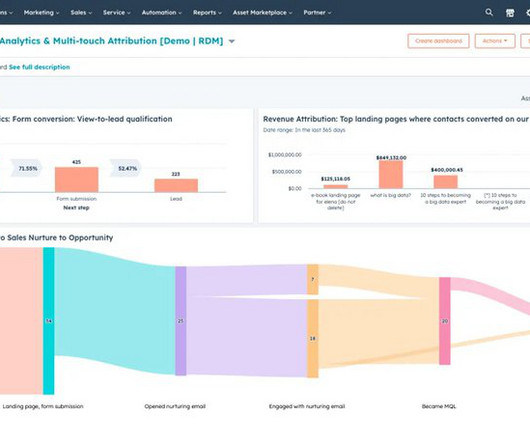
Unify your data to deliver better customer experiences : You can combine data using the flexible and customizable HubSpot marketing dashboards to see the initiatives that yield the best results for your business. For instance, the dropdown menu will show the names of specific blogs or landing pages where the CTA is.
Think about when they’re normally active on your app or program, or how often they might like to receive blog articles, news or updates from friends. Always A/B test. Before sending out mass push notifications, A/B test on a small percentage of your audience. Just keep testing! Frequency/timing. Delivery method.
The full session simulation tool goes beyond logon and allows you to record transactions and actions within your Citrix session – so you can test whether your SaaS , such as Salesforce are working properly in your Citrix session and how responsive they’re. to test the entire service delivery chain.
In this article, we’ll explore 7 product advertising examples to inspire you—from video ads and social media marketing to events and blogging. Userpilot lets you launch NPS surveys , trigger in-app messages , conduct A/B testing , and do customer segmentation. NPS dashboard in Userpilot. Get a demo.
Before you build a complete feature, run prototype tests to validate the ideas. Popular validation techniques involve fake door testing and the Wizard of Oz. Always beta-test your features before releasing them to the whole user base. User testing – you develop a high-fidelity prototype and watch users interact with it.
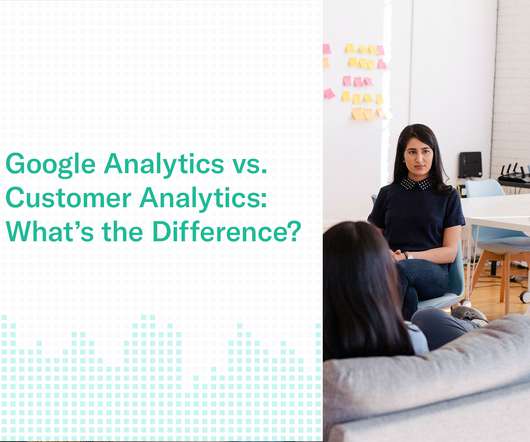
When you install Google Analytics on your website, you gain access to a basic data-dashboard in exchange for sharing insights with Google. A/B testing. Run routine A/B tests, across your marketing and core product experiences, to determine what is “most right” for your audience. Website Usage Analytics. See website traffic.
Collaboration and sharing – Public dashboards, scheduled reports, and other key features streamline collaboration and sharing with decision-makers. KPI tracking – Easily track KPIs, create dashboards, and visualize your analysis. A/B testing – Test product and marketing changes with real customers.
Snowflake consistently outperforms BigQuery on a number of performance metrics, according to benchmark tests performed by technology blog GigaOm. Business users can use these for different output visualizations and dashboards. Chartio helps people create dashboards for people to share within their organizations.
We previously discussed them in our blog post about Pendo here. We had a play with some of their tools to save you the trouble of testing them out yourself. If you sign up for a trial with Pendo, you are asked whether you initially want to explore Behavior Analytics , Dashboards, or Guides. 15% were untagged.
Userpilot is a product adoption tool with valuable features like segmentation, A/B testing, and real-time data tracking that help you meet customer needs. That can include interactions on mobile apps, your website, social media, or your product dashboard. Userpilot allows you to test all new hypotheses with A/B testing.
Our platform automatically calculates the results—a glance at the dashboard will show you the percentage of promoters, passives, and detractors. Userpilot’s NPS dashboard. Segmentation and experimentation : Easily combine Userpilot’s advanced segmentation feature with the built-in A/B testing flows to test your hypothesis quickly.
For example, include product tours , blogs, FAQs, video tutorials , etc. This includes regularly monitoring product analytics metrics to measure progress and visualizing data using analytics dashboards to draw valuable insights. Analytics dashboards in Userpilot. You need to constantly test, iterate , and improve.
We organize all of the trending information in your field so you don't have to. Join 96,000+ users and stay up to date on the latest articles your peers are reading.
You know about us, now we want to get to know you!
Let's personalize your content
Let's get even more personalized
We recognize your account from another site in our network, please click 'Send Email' below to continue with verifying your account and setting a password.


Let's personalize your content