This site uses cookies to improve your experience. To help us insure we adhere to various privacy regulations, please select your country/region of residence. If you do not select a country, we will assume you are from the United States. Select your Cookie Settings or view our Privacy Policy and Terms of Use.
Cookie Settings
Cookies and similar technologies are used on this website for proper function of the website, for tracking performance analytics and for marketing purposes. We and some of our third-party providers may use cookie data for various purposes. Please review the cookie settings below and choose your preference.
Used for the proper function of the website
Used for monitoring website traffic and interactions
Cookie Settings
Cookies and similar technologies are used on this website for proper function of the website, for tracking performance analytics and for marketing purposes. We and some of our third-party providers may use cookie data for various purposes. Please review the cookie settings below and choose your preference.
Strictly Necessary: Used for the proper function of the website
Performance/Analytics: Used for monitoring website traffic and interactions
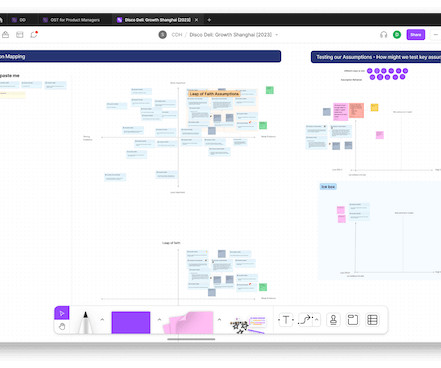
The opportunity solution tree helps visualize all the work that goes into continuous discovery. And while opportunity solution trees have become increasingly common among product teams, there’s still plenty of room for customization, both in the way you set up your trees and the tools you use to build them.
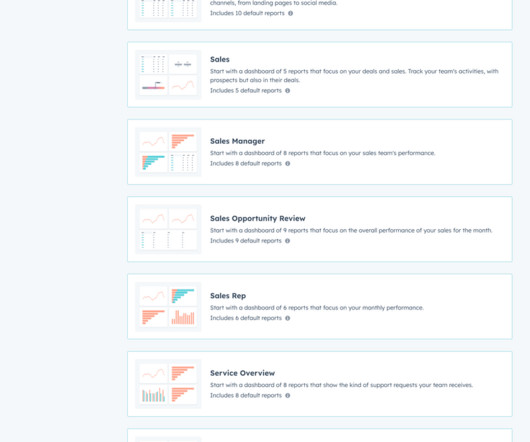
How to plan a dashboard people will use: 10 Key Steps Dashboard user interface elements in light and dark modes Our team has built dashboards for a wide range of businesses, and we’ve picked up a few key insights along the way. A truly functional dashboard is always the result of collaboration.
Part 3 (of 3) in the Designing UX Surveys That Work series. In this final part, well explore the broader landscape of common bias traps that can compromise your survey data and discuss strategies to minimise theirimpact. Seek contradictory evidence: Actively look for data that challenges your preconceived notions.
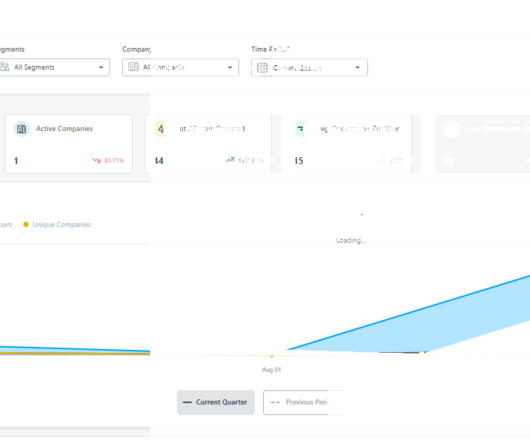
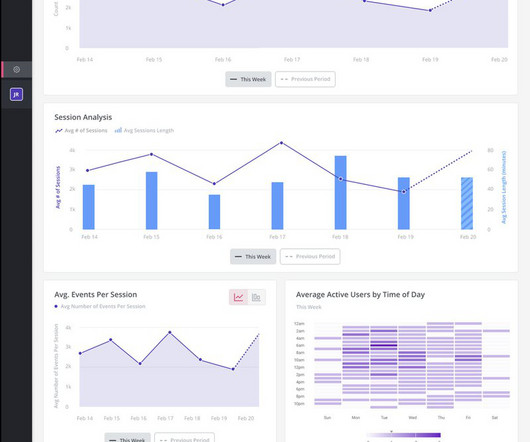
Are you tracking SaaS metrics without knowing how to make the analytics process easier? Analyticsdashboards are visualizationtools that give you an overview of key metrics. This makes it much easier to extract insights from your analysis compared to looking at mere numbers. Book a demo to learn more.
If you’re shopping around for a mobile app analytics platform before biting the bullet with Fullstory, you’ve landed in the right place. FullStory is a robust web and analyticstool but there are platforms out there that may specialize in one of the features you want. Best for AI-powered future outcomes predictions.
Inclusive by Design: Transform Your UI/UX from Good to Great In todays digital landscape, ensuring accessibility is no longer optionalit is a critical aspect of designing user interfaces (UI) and user experiences (UX). Some key disabilities to account forinclude: Visual impairments : Color blindness, low vision, or blindness.
I then moved into an interaction designer role before there was a UX title. This definition is a mouthful, so I like to visualize it. I’m going to walk through this visual quickly, and then Cecilie and I are going to dive into this in more depth. A core part of this is this visual. My book has habits in the title.
Today, almost any SaaS platform offers a reporting or insights module. A little investigative research on G2 uncovered the top 5 analyticsUX mistakes made by SaaS vendors. Lack of relevant insights 55% of SaaS platforms receive complaints about relevancy. But how are users experiencing these features?
The choice is tough because there’s no single tool that covers all use cases. What’s worse, you will find multiple tools in each category, making it incredibly difficult to pick the tool that satisfies your needs and offers the best value for money. Which product feedback software should you choose for your SaaS?
From Raw Data to Clarity — Cleaning, Sorting, and Synthesising Insights Part 4 (of 5) of the UX Research Playbook series Synthesising qualitative data is similar to reaping the harvest after the diligent effort poured into research — it’s the step where hard work blossoms into meaningful insights. is recommended.
How Companies Are Funding User Research in 2025: Insights from the User Interviews Research Budget Report User Interviews 2025 Research Budget Report is a crucial resource for understanding how modern organizations are approaching the financial side of user research. Only 17% experienced reductions. Lets unpack each.
What is data-driven analytics in SaaS? How to conduct user data analysis? What are the best analyticstools for the job? TL;DR Data-driven analytics describes the process of collecting, analyzing , and interpreting customer data to help organizations make better-informed product and strategic business decisions.
What happens when you build a product or service around what you think potential customers want, only for them to buy something else? It could include conducting user interviews and surveys, analyzing product usage data, and tracking customer feedback , to name a few. For starters, it shows you dont know your customers well enough.
Explore the secrets of creating a successful Crypto Prediction and Opinion Platform, and provide users with insights to help them navigate the cryptocurrency market wisely. Crypto prediction platforms provide valuable insights into the volatile world of cryptocurrency markets, aiding users in making informed decisions.
In today’s competitive landscape, customer experience (CX) stands as a cornerstone of success, particularly in the financial services industry. Whether through surveys, online reviews, or direct interactions, gathering actionable feedback provides invaluable insights into areas for improvement.
How can SaaS companies use self-serviceanalytics to gain the insights they need to drive product growth ? TL;DR Self-serviceanalyticstools enable non-technical product teams to access and analyze customer data without dev or data scientist support. What is self-serviceanalytics?
A customer sentiment dashboard is a great way to visualize customer feedback and see what users love (or hate) about your product. But how do you collect the right data for your analysis? This article shows you a step-by-step process and some of the best tools to use. Track customer behavior for experience insights.
Listen to the audio version of this article: [link] A Product Strategy System The product strategy system in Figure 1 consists of four main parts: people, processes, principles, and tools. Are the right tools applied? Next, collect the relevant data. Are they properly empowered and adequately qualified? If so, what are they?
No product tool or template can save you if you’re not killing it in these three areas. That’s why we’ve listed 12 tools that the best product managers use to do their jobs better? That’s why we’ve listed 12 tools that the best product managers use to do their jobs better?—?and and not the best product management tools.
This blog dives deep into: How AI is revolutionizing core PM functions The top AI-powered tools every PM should know The future skillset of the AI-native product manager Let’s explore how to stay ahead in this AI-first world. K-means, DBSCAN), PMs can visualize market segments dynamically. AI makes it actionable.
When it comes to continuous discovery , there’s no such thing as “the perfect tool.” Instead of seeking the best tool out there, it’s much more effective to look for the best tool for your team. Teresa often says, “The best tool is the one that your team will use.” Today, we’re taking a slightly different approach.
Do you want to learn how to use dataanalytics to improve customer experience? Many SaaS founders agree that customer insights are a key driver of product growth. After all, analyzing customer data can help you identify areas to improve upon and anticipate customer behaviors. Make data-driven decisions.
In the rapidly evolving world of User Experience (UX) research, one element often goes unnoticed but is absolutely critical: recruitment. While UX research focuses on uncovering insights to improve user experiences, recruitment ensures that these insights are grounded in high-quality data.
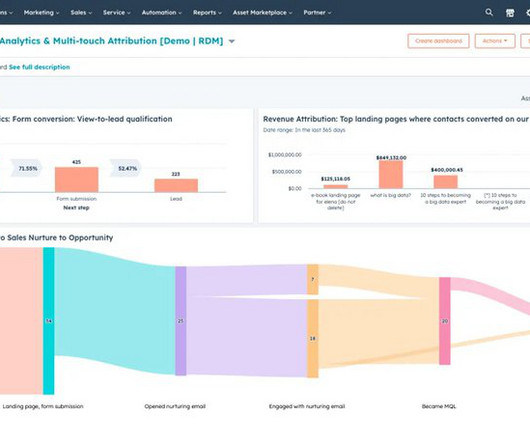
Hubspot customer journey analytics can help product managers tap into the pulse of their target customers. You can understand their journey, gain insights to improve their experience and connect your customer experience efforts to desired financial outcomes. HubSpot customer journey analytics.
As third-party data becomes less reliable, first-party analytics are going to shape most business decisions going forward. And the transition is already happening, as 88% of marketers think first-party data is more important now than a couple of years ago. While first-party data is completely private.
In this article, we’ll explain what user sentiment analysis is, why it’s important, and uncover some of the best tools for tracking and analyzing customer sentiment. TL;DR User sentiment is the feeling a person has about your brand, product, or service quality. Gather user sentiment data from multiple sources.
TL;DR A business intelligence (BI) analyst is a data specialist who helps businesses translate raw data into actionable insights. According to Glassdoor data, the estimated total pay for a Business Intelligence Analyst in the United States is $134,912 per year, with a base salary of $99,503 and additional pay of $35,409.
With over 20 years of experience across industries like financial services, healthcare, aerospace, and retail, Anne brings a strategic and innovative approach to product developmentone that focuses on speed, adaptability, and delivering real impact. When necessary, they pivot recommendations based on data and insights.
Choosing the best event-tracking tool for your business is not easy. To make the choice a bit easier for you, we’ve created a list of the best tools for tracking events available for SaaS teams in 2023. When choosing an event-tracking tool, first decide if you need to track user behavior inside a digital product or on a website.
Understanding and addressing user problems is a fundamental aspect of effective UX design. In this blog, we’ll discuss a few techniques and tools to identify user problems. Digging deeper into user problems helps UX designers identify user pain points and create experiences that fulfill their needs. Let’s get right to it.
Looking for the best no-code SaaS tools to build innovative solutions and improve your product management workflows? This article dives into some of the best tools in 2024. The no-code technology offers a drag-and-drop interface that makes these tools easy to use for non-technical teams. Userpilot can help.
In today’s AI-driven world, the excitement about artificial intelligence is widespread, with numerous tools available to shape our lives and the world. Our blog post guides you through the maze of AI research tools. But the question arises: How useful are the currently available tools, and what challenges do they generate?
Those who have already used product analytics software can imagine why a marketing hub for all your pages would be even more in-depth and complex. In this guide, we’ll go over which analytics HubSpot tracks, what its benefits are, and which features you can use! What is HubSpot analytics?
AI-driven user testing, video insights, plus seamless app distribution and expert resourcesâ discover Centercode 10x. Platform Overview Managed Services Compare Plans What's New? Platform Scalable, Automated, Real-World User Testing Centercode is the leading platform to manage impactful in-the-wild user tests.
You’ll find yourself working closely with UX and UI designers throughout your career as a Product Manager. The last thing you want to do when talking to a designer, is to use UX and UI interchangeably. UX (User Experience) and UI (User Interface) design are, in the grand scope of tech roles, somewhat similar. Want to know more?
From 2D screens to multi-dimensional experiences, UX design is evolving. Table of Contents What Is Spatial UX Design? What Is Spatial UX Design? Spatial UX is the discipline of designing user experiences where digital content exists in 3D physical space. Use curved UIs to match the user’s visual arc.
How to promote data democratization in your SaaS business to improve decision-making ? TL;DR Data democratization is the process of simplifying how data is stored and managed to help non-technical employees access it easily and make data-driven decisions. What is data democratization?
Under her leadership, Vydia’s Product team has successfully launched a record number of robust features in 2019, elevating the company’s services in content supply chain, rights management, analytics, and payments. and Automata Robotics over the last decade. You can find him on Twitter at [link]. The Best Product with Social Impact.
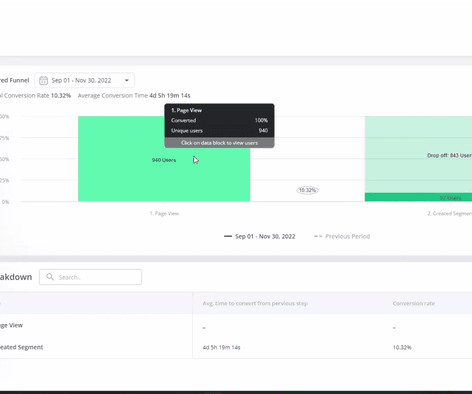
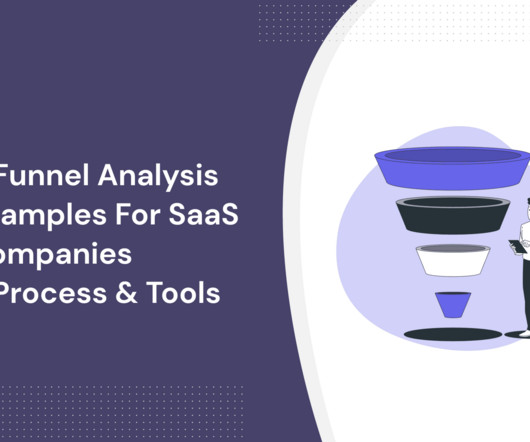
Discover the critical stages of each funnel and tools that help you gather actionable insights. TL;DR Funnel analysis helps map out all the steps website visitors and in-app users take to achieve conversion goals , like signing up for your tool or completing the onboarding process. Create data-driven product roadmaps.
The SaaS market is complex and dynamic: product managers who can successfully predict customer needs are a valuable commodity. In this article, we’re going to explore what customer needs are, how you can analyze customer behavior to extrapolate them, and ultimately how you can use your findings to predict the future.
With that in mind, the most decisive tool you have when facing uncertainty is knowledge. The Data / Information / Knowledge Paradox (Drawn From the DIKW Pyramid ). Data : data is feedback from your users, your market, or your product. Information: information is the output of data, after analysis. Analytical.
They combine insights from user research , dataanalytics, and design thinking to create cohesive and compelling experiences that align with business goals. Supplement your education with courses in user experience (UX) design , research methodologies, and data analysis. Book a demo to see it in action!
How can product and marketing teams leverage customer journey analytics to make data-driven decisions and build delightful customer experiences? TL;DR Customer journey analytics is the process of tracking user interactions at all the touchpoints in their journey. After that, analyze the data collected via various channels.
My team at Userpilot has helped countless product teams enhance their mobile UX without compromising performance. In this blog, Ill break down five mobile app optimization strategies that will help you. It ensures a smooth, engaging experience across performance, UX, and accessibility. Implement efficient data fetching.
We organize all of the trending information in your field so you don't have to. Join 96,000+ users and stay up to date on the latest articles your peers are reading.
You know about us, now we want to get to know you!
Let's personalize your content
Let's get even more personalized
We recognize your account from another site in our network, please click 'Send Email' below to continue with verifying your account and setting a password.


Let's personalize your content