This site uses cookies to improve your experience. To help us insure we adhere to various privacy regulations, please select your country/region of residence. If you do not select a country, we will assume you are from the United States. Select your Cookie Settings or view our Privacy Policy and Terms of Use.
Cookie Settings
Cookies and similar technologies are used on this website for proper function of the website, for tracking performance analytics and for marketing purposes. We and some of our third-party providers may use cookie data for various purposes. Please review the cookie settings below and choose your preference.
Used for the proper function of the website
Used for monitoring website traffic and interactions
Cookie Settings
Cookies and similar technologies are used on this website for proper function of the website, for tracking performance analytics and for marketing purposes. We and some of our third-party providers may use cookie data for various purposes. Please review the cookie settings below and choose your preference.
Strictly Necessary: Used for the proper function of the website
Performance/Analytics: Used for monitoring website traffic and interactions
Introduction to customersatisfaction surveys Customersatisfaction surveys are vital tools for understanding what customers think, feel, and experience. This information empowers teams across your company to make informed decisions based on customer experiences and perceptions.
According to the American CustomerSatisfaction Index , with an ACSI score of 78.0, overall customersatisfaction in America was the highest it has ever been in Q1 2024. However, while some companies have managed to improve their customersatisfaction levels and benefit from it, many have not.
Without effective UX analytics that goes beyond collecting data, you’re losing valuable customers. Unfortunately, the research backs this up, with a staggering 90% of users reporting that they stopped using an app due to poor performance. Why UX analytics should go beyond quantitative data. What is UX analytics?
While Kim didn’t directly own a P&L, her compensation structure became tied to business outcomes such as profitability, product growth, and customersatisfaction metrics. Kimberly has also led sales, partner programs, managed services and customer success over the course of her career.
Download Qrvey's guide to ensure your analytics keep pace so you can solve your user's biggest challenges, delight them, and set your product apart from the competition.
Customers dont care about data structures. Why Storyboarding Works A storyboard is just a sequence of visuals that shows how a user moves from a problem to a solution. Her team is buried in tickets, and customersatisfaction is slipping. Execs dont care about architecture diagrams. They care about impact.
Evolution of Customer Engagement Historically, customer engagement was limited to specific points in the process: Early problem validation Initial solution validation Requirements gathering Final product verification Modern Approach: Continuous Customer Engagement Today’s best practices involve customers at every stage: Market Space Phase Problem (..)
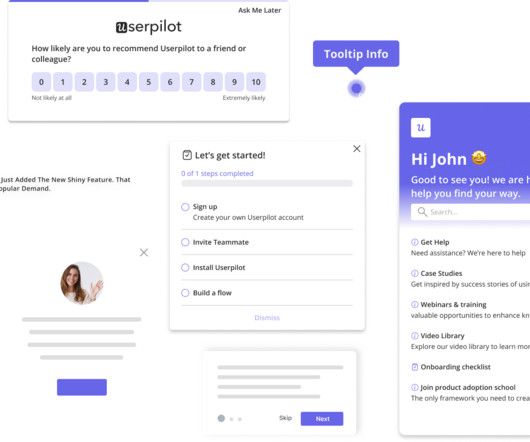
1 Userpilot for product teams to collect and act on NPS data Creating NPS surveys with Userpilot. Userpilot is a product growth platform that can collect customer feedback directly within your product. Get real-time insights into your survey responses, with visual breakdowns of data, NPS score, and trends.
Onboarding automation uses technology (such as conditional flows and sequences) to guide users through their initial experience with your product. Tools like Userpilot , for example, can help you automate data collection processes, welcome messages, account setup, in-app guidance, and more. Data security and compliance.
Speaker: Teresa Torres, Internationally Acclaimed Author, Speaker, and Coach at ProductTalk.org
Industry-wide, product teams have adopted discovery practices like customer interviews and experimentation merely for end-usersatisfaction. Data shows that the best product teams are shifting from this mindset to a continuous one. These methods are better than nothing, but how can we improve on this model?
Usersatisfaction score (CSAT). This metric is used to measure how satisfied users are with a product, service, or experience. CSAT is typically measured through surveys where users are asked to rate their satisfaction on a scale (e.g., Customersatisfaction score (CSAT) formula.
But it is changing, with AI tools that are transforming how we uncover and analyze customer needs. The AI Revolution in Voice of the Customer Research Early AI Experiments (2017-2018) AMS began experimenting with artificial intelligence for customer research around 2017-2018.
Well start with an overview and explore how AI can take on tasks such as analyzing userdata and automated prototyping to help professionals connect with users on a humanlevel. Its influence is growing across three key areas: innovative technologies, automation of design tasks, and personalized user experiences.
Tracking the right user metrics helps you precisely identify issues in the product experience rather than feeling lost in a sea of data. Choosing the wrong KPIs can be more damaging than you think – it drains your teams resources, shifts focus away from real problems, and ultimately, disrupts the customer experience.
I mean frictionless, user-obsessed, data-driven design choices that guide your customer from just browsing to Add to Cart without ahiccup. By watching these sessions, you can see firsthand how users navigate your site and use this data to streamline the user journey effectively.
Feedback flows into the right systems automatically Say a customer gives a low satisfaction score on a post-support survey. Instead of someone downloading that data later, the response instantly populates the customer’s record in Salesforce. This level of automation means: No time wasted on data entry or status checks.
Limit close-ended, multiple-choice questions to situations where clarity or specific data is required. By focusing on open-ended responses, you reduce survey design time and open opportunities to gather deeper insights without leading or biasing the customer. Use these questions liberally to uncover richer insights.
Simplify security OneSchema —Import CSV data 10x faster Michael Truell is the co-founder and CEO of Anysphere, the company behind Cursor—the fastest-growing AI code editor in the world, reaching $300 million in annual recurring revenue just two years after its launch.
Without a comprehensive view, businesses risk losing opportunities to improve customersatisfaction and build long-term loyalty. More accurate and actionable insights Relying on just one feedback channel (like post-purchase surveys) can lead to biased or incomplete data. That is where omnichannel feedback comes in.
Engaging in a well-structured product discovery process enables teams to move beyond assumptions and build solutions that drive true usersatisfaction. Conducting user research , including surveys and interviews, is essential for understanding target users and refining product features.
But how do you hone this crucial skill when faced with conflicting data, unsupportive leadership, or an over-reliance on gut feelings? Adjacent audiences: Rise in users (licenses) per account, Migration to higher paying tiers Market expansion: Pilot and experimentation of potential new offerings and challenging competitive ones.
Reveal Embedded Analytics For product owners, leveraging data is not just an advantageits a necessity. Product analytics empowers you to understand gaps in your offering and how users engage with your product. Whether its a mobile app, a web platform, or a SaaS tool, understanding user behavior is critical for improving performance.
Just look at Googles mantra: Focus on the user, and all else will follow. This mantra underscores the shift toward placing user needs at the heart of the design process. Yet, despite the data supporting user-centric design, 88% of online customers are less likely to return to a website after a poor experience.
In reality, UX is multidimensional, and it requires multiple qualitative and quantitative metrics like task success rate, usersatisfaction score, and summary of user reviews. Also, when you rely on one metric, the risk of data manipulation increases. More data always leads to betterinsights Data is the new gold.
From Raw Data to Clarity — Cleaning, Sorting, and Synthesising Insights Part 4 (of 5) of the UX Research Playbook series Synthesising qualitative data is similar to reaping the harvest after the diligent effort poured into research — it’s the step where hard work blossoms into meaningful insights. Mural , Miro , etc.) is recommended.
It’s not just about creating a great product—it’s about ensuring the entire customer journey, from initial interaction to post-purchase support, exceeds expectations. This gap can arise when decisions are based on assumptions rather than solid customerdata, leading to misaligned priorities in product development.
As companies mature, so does their understanding of how strategic research drives product innovation and customersatisfaction. For early-stage teams, this data is a wake-up call: underfunding research can mean missed insights, wasted development cycles, and slow product-market fit. The takeaway? Budgets are growing.
Custom dashboards to track key metrics at a glance. Analytics reports like paths, funnels, and cohort tables for visualizing user behavior data. Session replays to see how users navigate your product. 15+ survey templates (NPS, CES, usersatisfaction surveys, etc.) for collecting user sentiment data.
Feature adoption (users who use more advanced features). Customersatisfaction score and customer loyalty (NPS). With Userpilot, you can segment users based on multiple criteria, including: Demographics, like age, language, or location. You can then visualize the data as trends, funnels, paths, and heatmaps.
Instead of trying to eliminate these biases, a neuroscientific approach harnesses them for goodgently guiding users toward better decisions through well-timed nudges and simplified choices. It is also counterintuitive to think that less information might actually benefit users. In practice, it actually does the opposite.
It only measures promoters, which are loyal customers that are so infatuated with your product that they cant help but talk about it. However, so many companies use it to measure satisfaction. If 100% of your user base is satisfied with your product but only hits a score of 8. Then your NPS would be zero. Session replays.
When it comes to collecting customer feedback, it offers a survey template library, which includes all industry-standard surveys, like NPS and customersatisfaction surveys. The survey settings allow you to send it to a specific user group and set it to appear at regular intervals, for example, every 3-4 months.
To manage product-market fit effectively in a larger company, consider the following: Refine Product Strategy with Clear Market Insights In larger companies, product managers have access to more data and resources. Use this data to gain detailed insights into your target segments, emerging trends, and customer feedback.
Yet for many SaaS leaders, BI costs surge faster than customer acquisition, and legacy systems struggle to cope with growing data volumes and concurrent user demands. When analytics infrastructure can’t scale, costs balloon, and data loses its potential to drive smarter products. The result? You’re not alone.
Identify which strategies resonate most with users to optimize engagement and retention based on real data. Conclusion Gamifying your onboarding process increases user engagement by making the experience rewarding. As a SaaS company, implementing these game elements can help you: Accelerate user activation.
Monetization potential: If users spend significant time within your app but dont convert, that might indicate that your pricing or checkout flows need rethinking. Measure usersatisfaction : Metrics like session length and frequency of use evaluate if users are happy with the app experience. But then take action.
Supporting data and systems : Maintain a single source of truth for budgets, forecasts and ROI assumptions, easily accessible to finance partners. Supporting data and systems : Use a clear backlog system that makes technical debt visible and prioritised alongside features. Feed this data directly into prioritisation discussions.
Real user monitoring (RUM) bridges that gap by tracking every click, scroll, and frustration signalsuch as rage clicks or slow load timesallowing you to identify where users struggle. For product managers, this isnt just data; its the key to transforming disconnected user journeys into seamless experiences.
1 Engagement DAU/MAU Understand daily and monthly active user engagement and overall app popularity. 2 Engagement Feature adoption Gauge user interest in new features and optimize feature development. 3 Engagement Average user session length Measure user interactions and identify areas for improved content or flow.
Analyze Key Performance Metrics Examine financial and customersatisfaction metrics like average sales, costs, profit margins, and Net Promoter Scores (NPS). Declining trends in these areas can indicate that the product may no longer meet customer needs or deliver sufficient business value.
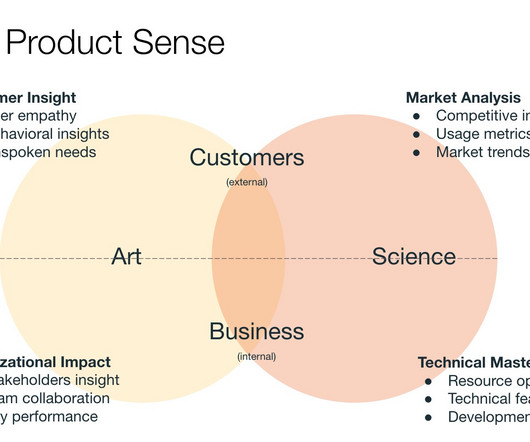
Picture this: A room full of product leaders huddled around market data like detectives at a crime scene, learning to spot the subtle clues that spell opportunity. Just as a master chef knows instinctively when a dish needs a pinch of salt, great product leaders cultivate an intuition that bridges data and action. The secret?
In-app guides are part of a self-serve onboarding strategy; they reduce support and customer success costs while increasing customersatisfaction. Users get access to help just when they need it. My favorite is Driven Action , which looks like a tooltip but requires the user to take action (e.g.,
Reveal Embedded Analytics Data-driven companies have a hidden advantage! Theyve consistently outperformed their counterparts, reporting significantly higher metrics across operational efficiency (81% vs. 58%) , revenue growth (77% vs. 61%), and employee satisfaction (68% vs. 39%). How is this possible?
We organize all of the trending information in your field so you don't have to. Join 96,000+ users and stay up to date on the latest articles your peers are reading.
You know about us, now we want to get to know you!
Let's personalize your content
Let's get even more personalized
We recognize your account from another site in our network, please click 'Send Email' below to continue with verifying your account and setting a password.


Let's personalize your content