
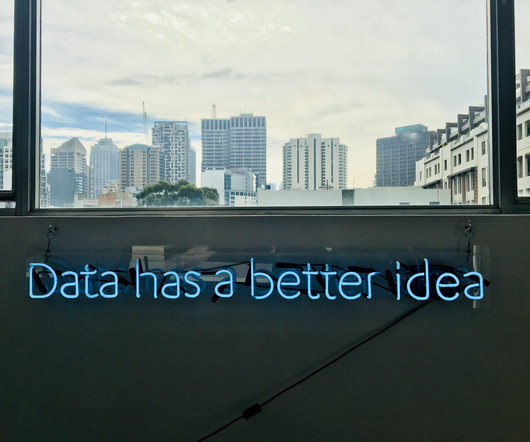
Get Creative: How to Be Data-Driven in a Data Desert
The Product Coalition
JULY 26, 2024
Here are some techniques you can use when data is scarce. No metrics? No problem! Continue reading on Product Coalition »
 Data Related Topics
The Product Coalition
JULY 26, 2024
Here are some techniques you can use when data is scarce. No metrics? No problem! Continue reading on Product Coalition »

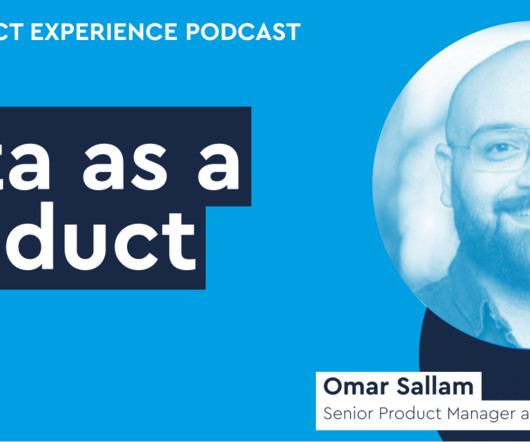
Mind the Product
DECEMBER 12, 2023
In the era of technological advancement, businesses, from startups to industry giants, are increasingly recognizing the pivotal role data plays in shaping strategic decisions. Embrace the concept of "data as a product" and revolutionize the way you perceive, manage, and leverage your data assets.
This site is protected by reCAPTCHA and the Google Privacy Policy and Terms of Service apply.
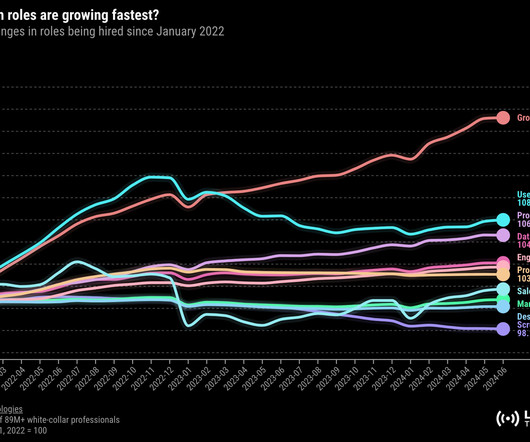
Lenny Rachitsky
JULY 23, 2024
I’m excited to share hot-off-the-presses data I haven’t seen elsewhere about the state of the product (and product-adjacent) job market. This data comes from a company that I recently discovered, Live Data Technologies , which has developed a method of prompt-engineering major search engines (e.g.

Mind the Product
MAY 6, 2024
In this article, she shares her insights and tips on data-driven time management. Read more » The post Data-driven time management for product managers appeared first on Mind the Product. Personally, she found out that she spent 1573 hours in meetings last year, with 70% initiated by herself.

Speaker: Aindra Misra, Sr. Staff Product Manager of Data & AI at BILL (Previously PM Lead at Twitter/X)
Embark on a transformation journey into the heart of the data ecosystem! This webinar is your gateway to a deeper comprehension of the foundations that drive the data industry and will equip you with the knowledge needed to navigate the evolving landscape. Delve into the diverse use cases where data analytics plays a pivotal role.
Userpilot
JULY 25, 2024
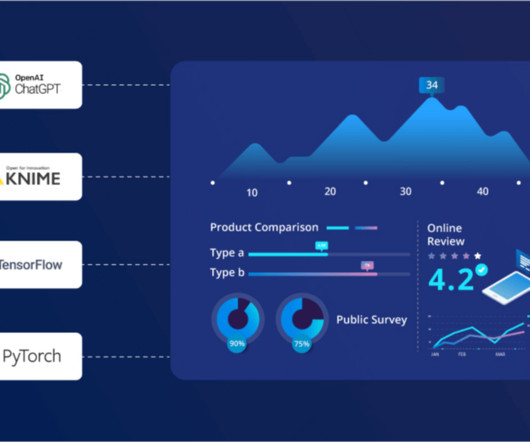
This guide will introduce you to the best resources available for data scientists, providing you with a curated selection of valuable materials to enhance your skills and knowledge. A data scientist collects, cleans, and analyzes data, develops predictive models, and communicates findings to stakeholders.
Product Talk
DECEMBER 13, 2023
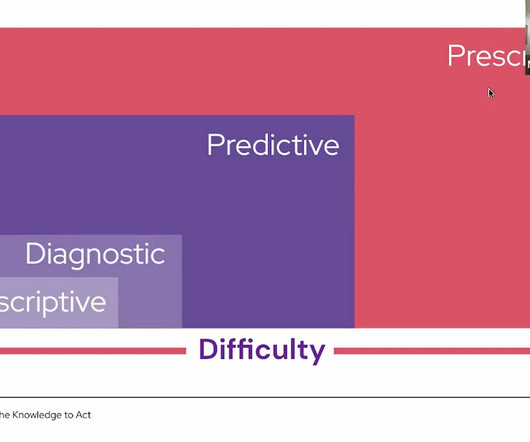
Bluestone Analytics, where Thomas works, offers a range of solutions related to data and analysis. Describing the product he’s responsible for, Thomas says, “My product squad owns presenting that data in a way that will make it easier for you to find the clues you’re looking for. Click the image to see a larger version.
Advertisement
With its unparalleled flexibility, rapid development and cost-saving capabilities, open source is proving time and again that it’s the leader in data management. But as the growth in open source adoption increases, so does the complexity of your data infrastructure.
Advertisement
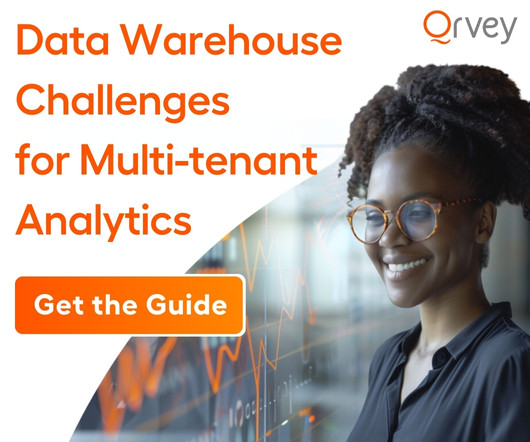
Multi-tenant architecture allows software vendors to realize tremendous efficiencies by maintaining a single application stack instead of separate database instances while meeting data privacy needs. When you use a data warehouse to power your multi-tenant analytics, the proper approach is vital.
Advertisement
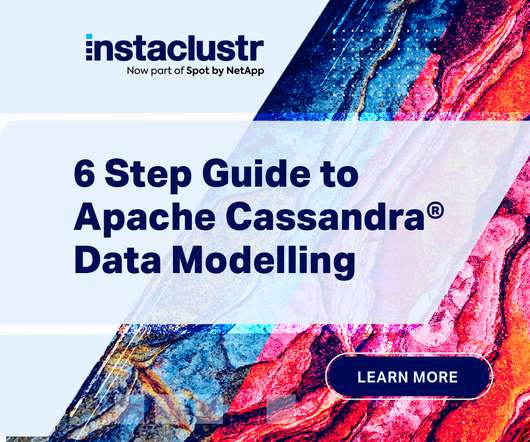
Discover a streamlined methodical approach to Apache Cassandra® data modeling. Are you a developer, database architect, or database administrator that's new to Cassandra, but been tasked with developing a plan for implementing the technology anyway? Worry no more.
Advertisement
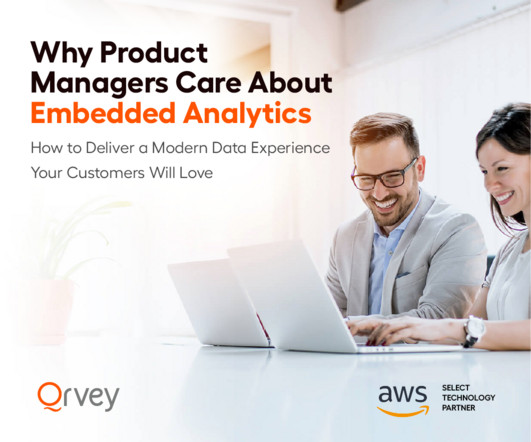
In embedded analytics, keeping up with the pace of innovation is challenging. Download Qrvey's guide to ensure your analytics keep pace so you can solve your user's biggest challenges, delight them, and set your product apart from the competition.
Advertisement
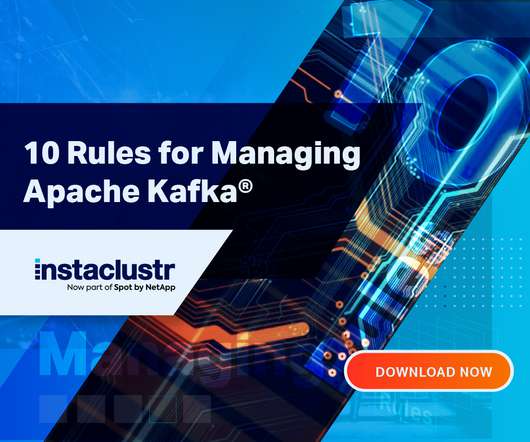
Apache Kafka is a powerful piece of software that can solve a lot of problems. Like most libraries and frameworks, you get out of it what you put into it. Learn 10 rules that will help you perfect your Kafka system to get ahead.

Advertisement
Adding high-quality entity resolution capabilities to enterprise applications, services, data fabrics or data pipelines can be daunting and expensive. Organizations often invest millions of dollars and years of effort to achieve subpar results.

Advertisement
Many organizations today are unlocking the power of their data by using graph databases to feed downstream analytics, enahance visualizations, and more. The quick-to-deploy Senzing® entity resolution API enables graph database users to gain insights from their data they couldn’t see before.
Advertisement
Instaclustr expert Perry Clark outlines immediate actions to minimize risks, ensuring a swift response to ransomware threats and protecting critical data assets. The guide explores troubleshooting techniques for data recovery, emphasizing essential questions to comprehend the full impact of an attack.

Expert insights. Personalized for you.


Let's personalize your content