This site uses cookies to improve your experience. To help us insure we adhere to various privacy regulations, please select your country/region of residence. If you do not select a country, we will assume you are from the United States. Select your Cookie Settings or view our Privacy Policy and Terms of Use.
Cookie Settings
Cookies and similar technologies are used on this website for proper function of the website, for tracking performance analytics and for marketing purposes. We and some of our third-party providers may use cookie data for various purposes. Please review the cookie settings below and choose your preference.
Used for the proper function of the website
Used for monitoring website traffic and interactions
Cookie Settings
Cookies and similar technologies are used on this website for proper function of the website, for tracking performance analytics and for marketing purposes. We and some of our third-party providers may use cookie data for various purposes. Please review the cookie settings below and choose your preference.
Strictly Necessary: Used for the proper function of the website
Performance/Analytics: Used for monitoring website traffic and interactions
Having trouble deciding which customer service KPI to use? There are some vanity metrics among the KPIs for customer service. So let’s look at the most important KPIs that will help you create strategies to provide superior customer service and boost retention. Improve customersatisfaction.
The retention stage is all about keeping your existing customers satisfied and engaged with your product to ensure they continue using it over the long term. And that’s why you should track the following: Customersatisfaction to assess how content your users are. What are the 5 main stages of a customer journey?
Best way to track and measure product management KPIs. Product management KPIs help product teams outline and track the business or product success. KPI stands for Key Performance Indicator, and OKR stands for Objectives and Key Results. What are product management KPIs? What’s the difference between KPIs and OKRs?
I’ve seen several different approaches, including themes that align with high-level business goals (acquisition, growth, customersatisfaction, etc.) or more granular focus areas like the example in Jim Semick’s article of increasing satisfaction within a user persona group. CUSTOMERKPI: Reach.
Behavioral UX KPIs include Average Time Spent on Task, Task Success Rate, Error Occurrence Rate, Navigation vs. Search, and Conversion Rate. Some examples of attitudinal UX KPIs are Feature Adoption Rate , CustomerSatisfaction Score (CSAT), Net Promoter Score (NPS), System Usability Scale (SUS), and Customer Retention Rate.
Go ahead and skip directly to the product marketing KPIs list or continue to read if you’re just starting out and looking to understand more about what product marketing is first. What is a Product Marketing KPI metric? Product Marketing KPIs vs Product Marketing OKRs. What is a Product Marketing KPI metric?
On the other hand, KPIs highlight your success in achieving a key result, and metrics provide data you can track to identify bottlenecks in your business. To implement your OKR strategy, you should follow 5 steps: set vision, choose OKRs, review OKRs progress, create feedback loops, and make reports. OKR vs KPI vs Metrics.
How to find the right software for your needs. TL;DR Analyzing survey data can help you identify patterns, get ahead of issues, and make data-driven decisions moving forward to reduce churn while improving customersatisfaction. In this guide, we’re going to go through: The SaaS analytics you can gather through surveys.
Collecting customer feedback helps to build user-centric products, measure satisfaction, identify areas for improvement, and boost user retention. Types of surveys include: CustomerSatisfaction Score (CSAT). Track overall satisfaction with your product or service. Net Promoter Score (NPS).
. – Use interactive walkthroughs to guide users and more. Userpilot is a versatile product growth platform that can help you collect the necessary data and build personalized in-app experiences code-free. What are customer success OKRs? ” KPI vs. OKR. Key results Boost usersatisfaction rate by 20 %.
A feature adoption funnel moves users through the four stages of adoption (Exposed > Activated > Used > Used Again) with the goal of maintaining healthy feature adoption rates across the board. Make the onboarding process as contextual and enjoyable as possible to kick the customer experience off on a high note.
Wondering how you can leverage sentiment analysis to improve customer experience? Customers are actively sharing their thoughts on social media and review sites, making these places valuable sources of customer feedback. You can significantly enhance your customer experience using sentiment analysis.
TL;DR Customer analytics platforms are specialized tools that allow you to collect and analyze data. Customer analytics deliver many benefits for companies, such as improving customersatisfaction , driving customer loyalty , and increasing customer lifetime value. Starts at Silver’s $199/month.)
It involves adapting your product to your customer’s ever-changing expectations through in-app surveys and review gathering, making it timeless. Value realization is when a customer experiences and recognizes the value of your product or service. Return on investment (ROI) is the most famous KPI. Optimization.
A product analytics tool is a type of software that enables you to measure and visualize user data. Product analytics software varies but most have similar features, such as data capturing, customized segmentation, and KPI dashboards. Common product analytics software features. Tracking custom events.
This stage aims to nurture advocacy and ultimately increase the number of repeat customers and boost customer engagement. You measure success in this stage using customer loyalty , customersatisfaction , and the number of active customers. RACE is KPI-powered and based on a performance improvement process.
Userpilot is a product growth platform that helps product teams deliver personalized in-app experiences for their users, that increase growth metrics at every stage of the user journey. SaaS User Persona Example – Userpilot: Customer Success Manager. ActiveCampaign user persona example Senior Marketer for Ecommerce.
You might also be interested in: The ultimate app KPI cheat sheet Activation rate Inviting people to download your app is one thing, but activating users is another task. The results help to understand where and what might distract users from completing their goals in the app, which could then be improved on the design level.
Ultimately, upping your NPS contributes to both happier users and more growth. By zooming in on your NPS, you can increase repeat customers and spark a reputation that grows through positive reviews. One of the most valuable product management KPIs out there is time to value (TTV). CustomerSatisfaction (CSAT).
Thankfully, you don’t get to watch your customers browsing through your products or landing page (privacy for the win). Due to this, understanding their behavior and knowing what they want becomes slightly challenging. To analyse user behavior in a better way, it is crucial to understand all the three aspects of it.
This process can lead to higher customersatisfaction, engagement rate, and conversions. At Imaginary Cloud, it is done at a growth stage when you will be able to unlock insights about where users are having trouble and what features are working or not. requiring a complete redesign. Plan your website redesign.
Account Attributes – Microsurvey – No Code – NPS – OAuth – Self Serve. Account Attributes are descriptive data (or metadata) associated with a record or user profile. By recording the user’s name as an Account Attribute, for example, it is possible to deliver a more personalized experience.
Its difficult to drive engagement and retention without a structured approach to understanding user needs and behaviors. Say someone leaves a negative review about your app on Twitter or LinkedIn. Do you have a system for checking if it’s a one-person issue or something that affects the rest of your users too?
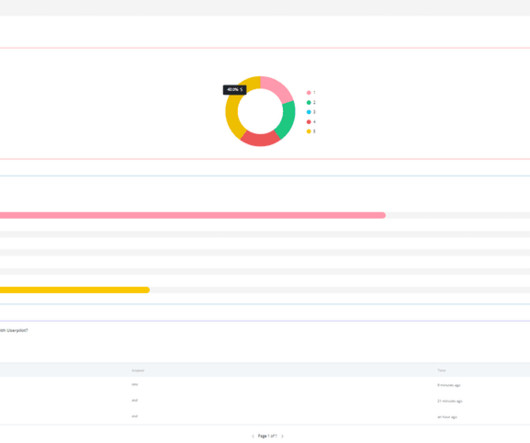
Your mobile app KPI dashboard is supposed to answer questions, not create more. But when user engagement drops and every tool tells a different story, its hard to know whats actually going wrong. Google Analytics says one thing, your product management dashboard says another, and customer support data adds more noise than clarity.
We organize all of the trending information in your field so you don't have to. Join 96,000+ users and stay up to date on the latest articles your peers are reading.
You know about us, now we want to get to know you!
Let's personalize your content
Let's get even more personalized
We recognize your account from another site in our network, please click 'Send Email' below to continue with verifying your account and setting a password.


Let's personalize your content